
NGINX Ingress Controller from F5 NGINX combined with the Prometheus operator ServiceMonitor CRD makes gathering metrics from NGINX Ingress Controller deployments much easier and much faster using Helm. The NGINX Ingress Controller helm chart now supports the ability to immediately take advantage of your existing Prometheus and prometheus-operator infrastructure, allowing you to deploy NIC and have metrics out of the box leveraging Prometheus ServiceMonitor. This article walks you through what ServiceMonitor is, how you can install it, and how you can use the NGINX Ingress Controller helm chart to define these specific settings.
Prometheus ServiceMonitor
The Prometheus ServiceMonitor custom resource definition (CRD) allows you to declaratively define how a dynamic set of services should be monitored. The services monitored are defined using Kubernetes label selectors. This allows an organization to introduce conventions governing how metrics are exposed. Following these conventions, new services are automatically discovered, and Prometheus begins gathering metrics without the need to reconfigure the system. ServiceMonitor is part of the Prometheus Operator. These resources describe and manage monitoring targets to be scraped by Prometheus. The Prometheus resource connects to ServiceMonitor using a ServiceMonitor Selector field. Prometheus can easily identify what targets have been marked for scraping. This gives you more control and flexibility to leverage ServiceMonitor resources in your Kubernetes cluster to monitor solutions like NGINX Ingress Controller. To make things easier and provide out-of-the-box metrics for NGINX Ingress Controller, we recently added the ability to use Prometheus ServiceMonitor to our helm chart. This makes it quite easy to enable metrics for Prometheus to begin scraping right after deploying NGINX Ingress Controller. To use this feature, we need to add a second service specifically created for metrics collection that ServiceMonitor will “attach” to. This will tell the Prometheus operator what service it should monitor (using the labels in the metadata) so it knows what and where to scrape. Example of what a service for NGINX Ingress Controller would look like if part of deployment or helm files:
The above will be part of the deployment. The label, app: nginx-ingress-servicemonitor “connects” to the serviceMonitor for Prometheus metric scraping. Below is a sample serviceMonitor that would link to the above service named nginx-ingress-servicemonitor:
It is necessary to create a Prometheus resource, which is configured to look for the serviceMonitor resources, allowing Prometheus to quickly and easily know what endpoints to scrape for metrics. In our example below, this resource tells Prometheus what items to monitor under the spec. In the below, we are monitoring spec.serviceMonitorSelector.matchLabels:. We can see that Prometheus is looking for matchLabels with app.nginx-ingress-servicemonitor in any namespace. This matches the serviceMonitor resource that will be deployed by the NGINX Ingress Controller helm charts and Helm.
Here is a diagram the connects the different pieces:

Installing Prometheus, prometheus-operator and Grafana
We are going to use the prometheus-community/kube-prometheus-stack to install the full deployment. This will install prometheus, prometheus-operator and Grafana. We are also going to specify we want to install this in the monitoring namespace for isolation. Here is how we can install with helm: helm install metrics01 prometheus-community/kube-prometheus-stack -n monitoring --create-namespace
Create and install Prometheus resource
Once Prometheus and the Prometheus CRDs are installed into the cluster, we can create our Prometheus resource. By deploying this ahead of time, we can “pre-plumb” our Prometheus setup with the labels we will use in the helm chart. With this approach, we can automatically have Prometheus start to look for NGINX Ingress Controller and scrape for metrics. Our Prometheus resource will be deployed prior to installing NGINX Ingress Controller. This will allow the prometheus-operator to automatically pick up and scrape our NGINX Ingress controller after deployment, providing metrics quickly.
Our example above is a basic example. The key part is the spec.serviceMonitorSelector.matchLabels value we specified. This value is what we are going to use when we deploy NGINX Ingress controller with the helm chart. We want to provide Prometheus metrics out of the box. To do so, we are going to use NGINX Ingress Controller helm chart.
NGINX Ingress Controller helm values.yaml changes
We can review the values.yaml file for the helm chart. There is a Prometheus section we want to focus on as it has the required pieces needed to enable Prometheus, create the required service, and create a serviceMonitor resource. Under the Prometheus section, we should see several settings: prometheus.service prometheus.serviceMonitor We are going to enable both of the above settings, to generate the required service and serviceMonitor when using the helm chart. Here is the specific section where we enable the service, enable serviceMonitor, and define the labels in the serviceMonitor section:
Breaking out the values from the above:
Tells Helm you want to enable the NIC Prometheus endpoint. You can additionally define a port, scheme, and secret if required. By setting the value of prometheus.service.create to true, Helm will automatically create the NIC ServiceMonitor service.
Lastly, we need to create the serviceMonitor. Setting this to true and adding the correct labels will create and add the labels that match our Prometheus resource.
The label links back to the name of the service.labels: { app: nginx-ingress-servicemointor } To Summarize. Enable Prometheus, this exposes the Prometheus exporter capability of NIC. Define a Service object, this is how the Prometheus ServiceMonitor discovers NIC Prometheus exporter endpoints. Define a serviceMonitor object. This tells Prometheus ServiceMonitor to monitor this thing.
Now we can install NGINX Ingress Controller with helm.
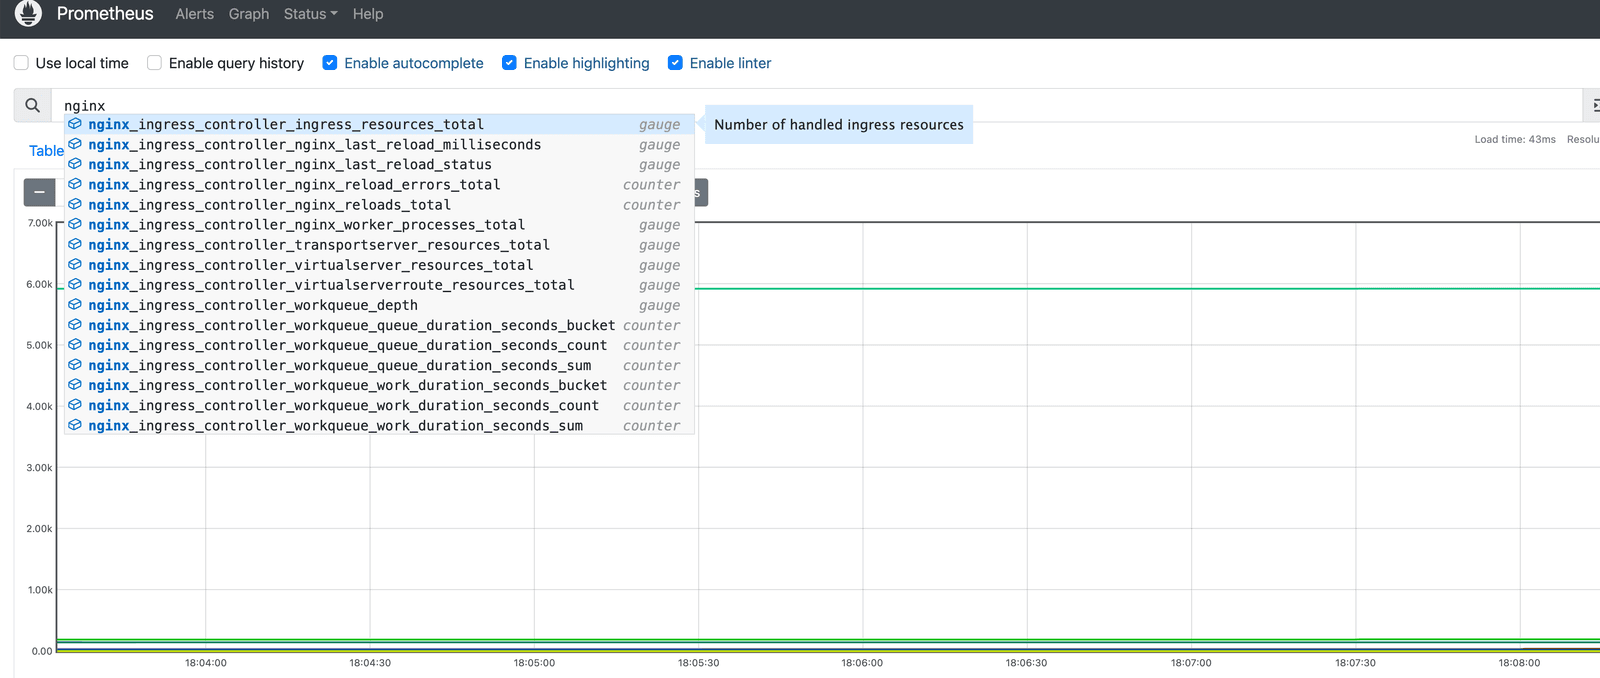
Once we have modified our values.yaml, we can then proceed to install NGINX Ingress controller. helm install nic01 -n nginx-ingress --create-namespace -f values.yaml . After we deploy NGINX Ingress Controller, we can open up the Prometheus dashboard and navigate to status menu. From there we can navigate to the targets and service discovery views. Once Prometheus locates our new ServiceMonitor resource, it will begin to scrape the endpoint and collect metrics which are immediately picked up in the Prometheus dashboard.
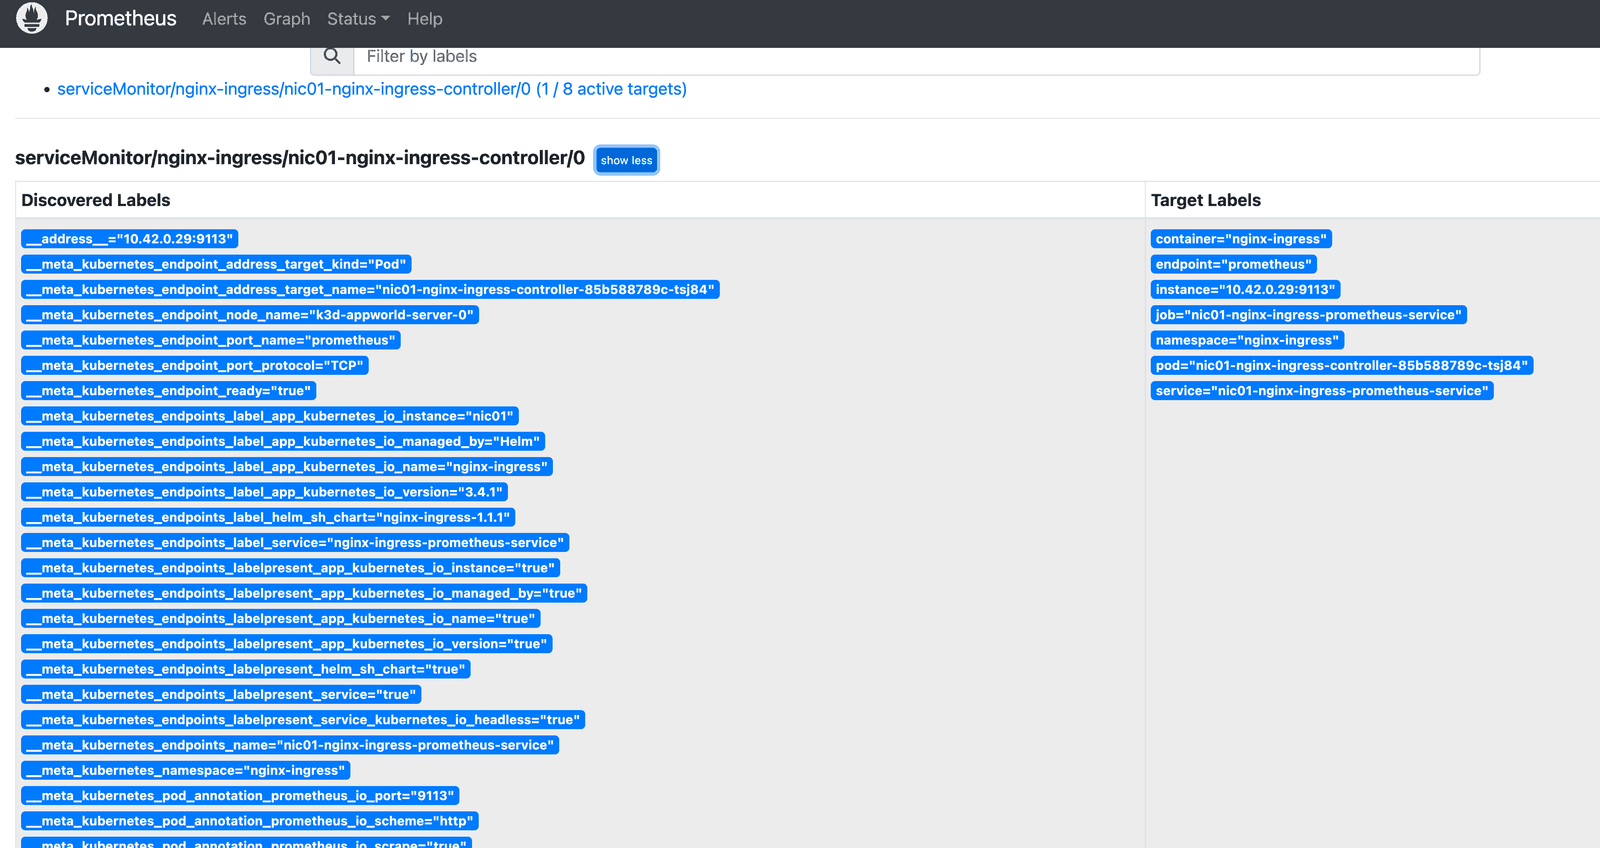
Figure 3: Prometheus target
We can see that using native Kubernetes tools like helm and Prometheus, NGINX Ingress Controller can make collecting metrics at the start of deployment a lot easier, providing “out of the box metrics”. Here are reference documents to installing prometheus-operator: https://prometheus-operator.dev/ https://github.com/prometheus-operator/prometheus-operator
About the Author
Related Blog Posts

Secure Your API Gateway with NGINX App Protect WAF
As monoliths move to microservices, applications are developed faster than ever. Speed is necessary to stay competitive and APIs sit at the front of these rapid modernization efforts. But the popularity of APIs for application modernization has significant implications for app security.

How Do I Choose? API Gateway vs. Ingress Controller vs. Service Mesh
When you need an API gateway in Kubernetes, how do you choose among API gateway vs. Ingress controller vs. service mesh? We guide you through the decision, with sample scenarios for north-south and east-west API traffic, plus use cases where an API gateway is the right tool.
Deploying NGINX as an API Gateway, Part 2: Protecting Backend Services
In the second post in our API gateway series, Liam shows you how to batten down the hatches on your API services. You can use rate limiting, access restrictions, request size limits, and request body validation to frustrate illegitimate or overly burdensome requests.
New Joomla Exploit CVE-2015-8562
Read about the new zero day exploit in Joomla and see the NGINX configuration for how to apply a fix in NGINX or NGINX Plus.
Why Do I See “Welcome to nginx!” on My Favorite Website?
The ‘Welcome to NGINX!’ page is presented when NGINX web server software is installed on a computer but has not finished configuring