The Sensor Intel Series is created in partnership with Efflux, who maintains a globally distributed network of sensors from which we derive attack telemetry.
Additional insights and contributions provided by the F5 Threat Campaigns team.
-----------------------------------------------------------------------------
Introduction
Welcome to the July 2024 installment of the Sensor Intelligence Series, our monthly summary of vulnerability intelligence based on distributed passive sensor data.
Last month we observed a massive increase in scanning for CVE-2017-9841 as well as continued increases in scanning for CVE-2023-1389 and scanning for a newly discovered PHP vulnerability – CVE-2024-4577.
This month, we observed the scanning for CVE-2017-9841 fall sharply, and we’ll get to that in a moment.
CVE-2023-1389, an RCE vulnerability in TP-Link Archer AX21 consumer routers, also fell sharply, returning to levels not seen since April 2024. In fact, overall scanning traffic fell off significantly but was mainly driven by the decrease in scanning for the two above vulnerabilities.
Following Up On CVE-2017-9841
The massive increase in scanning last month for CVE-2017-9841 made us really shake our heads. Not only was it huge, but it was also clearly done by the same scanning actor, given the similarities in the URLs scanned, the lack of any variability in header values, and the similarity of other URLs scanned from the same IPs and ASNs.
At the time, we had a lot of unanswered questions, most relevant of which was why would this scanning actor suddenly more than double their infrastructure in terms of both IPs and ASNs?
Unfortunately, we may never know for certain, but whatever the reasons, the massive change in both volume and source has now fallen off sharply, some of the lowest levels of unique source IPs and ASNs seen this year. The total events is still elevated from the average of the first six months of the year, and above average even if we remove the increases from May and June, but is now a mere 9000 or so scans detected, vs. the 76,000 we observed last month.
We dug into the sources of these scans and looked at what else they are targeting and found some interesting information.
First off all, scanning for this vulnerability has been present in our dataset from the very beginning of this project, all the way back in 2020. The following table shows the number of scans detected across our entire data set, by year.
| Year | n |
| 2020 | 40609 |
| 2021 | 149650 |
| 2022 | 58500 |
| 2023 | 30382 |
| 2024 | 109748 |
Table 1: CVE-2017-9841 scanning by year, which peaked in 2021.
Scanning peaked in 2021 and decreased in 2022, but in just the first six months of 2024, this situation changed, with 100,607 events observed, and then fell massively in July. Breaking this out by month shows very clearly the massive increase, and adding additional fields reveals some interesting patterns.
| Month | Unique Source IPs | Unique Source ASNs | Unique Source Countries | Unique Headers | Countries Targeted | Total Events |
| January 2024 | 224 | 62 | 39 | 1 | 35 | 2148 |
| February 2024 | 327 | 82 | 43 | 1 | 34 | 2555 |
| March 2024 | 637 | 101 | 49 | 1 | 34 | 2397 |
| April 2024 | 219 | 68 | 43 | 1 | 34 | 2320 |
| May 2024 | 324 | 98 | 41 | 1 | 33 | 15254 |
| June 2024 | 814 | 233 | 54 | 1 | 33 | 75933 |
| July 2024 | 163 | 76 | 44 | 1 | 34 | 9141 |
Table 2: Breakdown of scanning sources for CVE-2017-9841, by source IP, source ASN, source country, unique headers observed, and countries targeted.
Note the large increase and then decreases in the number of unique source IPs and source ASNs. Between May and June, 38 different source ASNs dropped from the scanning activity, and 179 were added. Between June and July 2024, 157 ASNs and 651 IP addresses fell out of use.
This sort of massive fluctuation is, as we have noted previously, unusual to observe when it comes to a specific scanning actor. Most scanners don’t vary their infrastructure a great deal. One assumes that they have a setup that works, and usually don’t bother to move around a great deal unless they are under pressure or losing access to infrastructure due to takedowns.
Regardless, the owners of unpatched, and uncompromised PHPUnit installations dating from 2022 (if any indeed exist) can breathe a sigh of relief.
July Vulnerabilities by the Numbers
Figure 1 shows July attack traffic for the top ten CVEs that we track. Note the continued presence of CVE-2023-1389, and CVE-2017-9841, but also the return of a few old friends that have been absent from recent Top 10s, including the 2018 JAWS Web server vulnerability (which does not have a CVE assigned to it) as well as CVE-2022-41040/CVE-2021-34473, a pair of Microsoft Exchange Server vulnerabilities. The actual level of scanning for these vulnerabilities has remained relatively constant, however, so it’s appearance in the top ten this month is indicative of the reduction in total scans for other vulnerabilities.
Targeting Trends
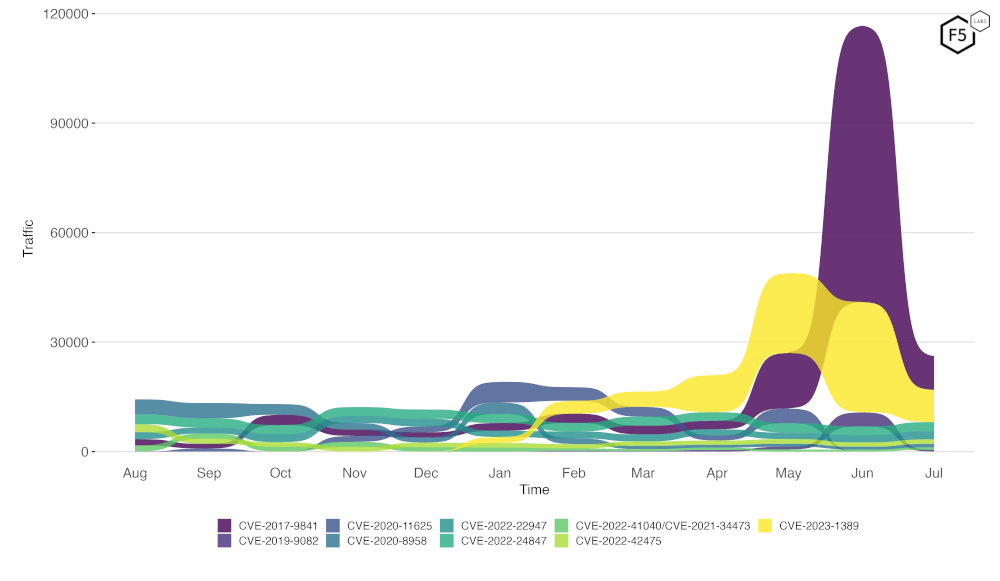
Figure 2 is a bump plot showing the change in traffic volume and position over the last twelve months. This shows very clearly the massive fall off in scanning for CVE-2017-9841, as well as a similar decrease in scanning CVE-2023-1389, with its total volume (seen in the width of the colored area) indicating that scanning for this vulnerability has fallen off to levels not seen since April 2024.

Figure 2. Evolution of vulnerability targeting in the last twelve months. Note the huge decrease in scanning for CVE-2017-9841.
Long Term Trends
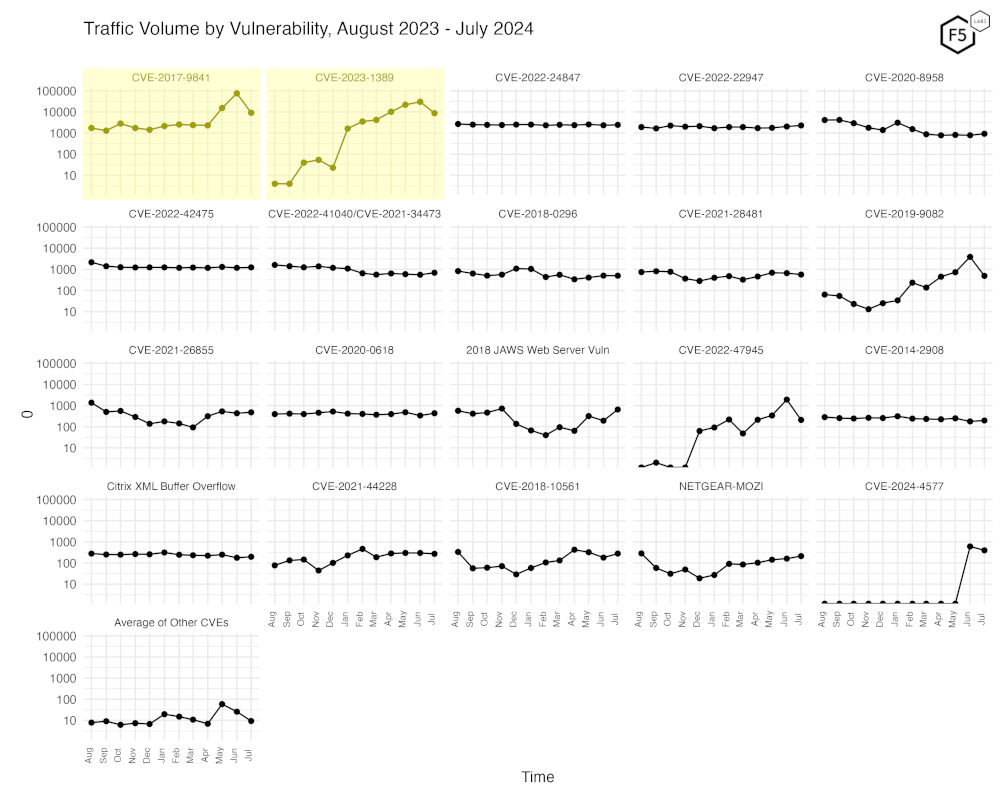
Figure 3 shows traffic for the top 19 CVEs by all-time traffic, followed by a monthly average of the remaining CVEs. This shows quite clearly the falloff in scanning for CVE-2017-9841 at the top left. The reduction in scans for CVE-2023-1389 is also clearly visible.

Figure 3. Traffic volume by vulnerability. This view accentuates the recent changes in both CVE-2023-1389 and CVE-2017-9841.
Conclusions
Scanning for the CVEs we track may be down, but it’s important to note that the overall level of scanning activity across all sensors and all observed traffic has not varied a great deal – it fell by just 2.2% from June to July. As we have noted before the vast majority of the scanning we observe does not directly target CVEs, but rather is directed towards finding sensitive data inadvertently exposed due to misconfigurations, and to find web-based login forms for administrative interfaces, especially for web-based database front ends. The watchword of constant vigilance still applies.
Recommendations
- Scan your environment for vulnerabilities aggressively.
- Patch high-priority vulnerabilities (defined however suits you) as soon as feasible.
- Engage a DDoS mitigation service to prevent the impact of DDoS on your organization.
- Use a WAF or similar tool to detect and stop web exploits.
- Monitor anomalous outbound traffic to detect devices in your environment that are participating in DDoS attacks.


