Executive Summary
In today’s digital landscape, bots dominate the internet, with some estimates suggesting they account for over 50% of all website and mobile API activity. Beneficial bots support search engines, fulfill genuine business needs, and automate repetitive tasks. While some are outright malicious and enable fraud, many other bots operate somewhere in the middle—in the murky grey area between illegal and immoral. They ignore website terms of use, prevent customers from purchasing goods and services, and can even weaken security. Existing research often examines uncontrolled bot traffic across the entire internet, but this report takes a different approach and, instead, focuses on how automated traffic changes after bot mitigation is put in place.
We provide a detailed analysis of bot types, their objectives, and industry-specific impacts. A key focus is on advanced and persistent bots—those that adapt as security measures evolve. Malicious actors, including nation-states and cybercriminals, frequently modify tactics to bypass defenses, increasing attack sophistication or moving to softer targets.
This report analyzes over 200 billion web and API transactions from F5’s Bot Defense customers from November 2023 to September 2024. Because these organizations have long-standing bot protection, the data highlights the most persistent and advanced bot and automation activity. We define ‘automation’ as any malicious non-human traffic targeting protected applications and ‘transactions’ as HTTP requests to and from a client device. Our analysis divides traffic by application type. ‘Web’ refers to traditional websites, and ‘mobile’ (or ‘mobile API’) are Android and iOS mobile applications which make use of an API call to load data onto the device. Collectively, we refer to ‘web’ and ‘mobile API’ as ‘platforms’.
Looking at all HTTP requests across all sectors and platforms, we found an average of 10.2% (21.22 Billion) were bots and other forms of automation.
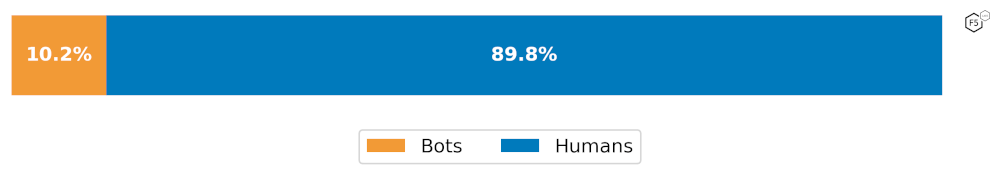
Figure 1: Average automated traffic across all industries after bot mitigation was enabled.
Not all bot traffic was entirely malicious. Of all the HTTP transactions, 2.0% (4.06 Billion) came from known financial aggregators (commonly used by money management apps). A total of 3.5% of transactions (7.18 Billion) were from bots we categorize as “flagged automation” (comprised of allowed automation from external sources as well as automation on applications that customers have in monitoring mode). Finally, 4.8% transactions (9.98 Billion) were unwanted bots that were mitigated by F5.
While 4.8% sounds like a modest number it is important to remember that this figure represents an average across all bot types across all industries. As we explain in more detail later, these are bots which have persisted long after mitigation has been put in place. The average quantity of bots affecting sites and APIs without mitigation is often far higher. As previously reported on in our 2023 Identity Theft Report, the average quantity of bots attacking login pages alone averages 20% across all industries, with some sectors seeing upwards of 80% of all login traffic originating from bots. See Impact of Mitigation for further analysis of the effects of bot mitigation. |
When examining bot traffic broken out by sector, we found that the Hospitality industry experienced the highest levels of unauthorized bot traffic against web platforms, with almost 45% of all transactions coming from automated activity, primarily driven by web scraping. When focusing on mobile API endpoints, the Entertainment industry was worst hit, with 23% of all traffic originating from unauthorized bots.
Most industries saw a decline in automation targeting their web and mobile API endpoints when compared to the 2024 Bad Bots Review. Unauthorized bot traffic decreased in 15 of 26 of industry-platform combinations. The largest web platform declines were in Telecoms (-18.5%), Healthcare (-10%), and Airlines (-9.2%). Mobile API decreases were seen in Entertainment (-11.5%) and Fashion Retail (-8.3%). This trend aligns with the expectation that persistent bot mitigation deters threat actors. Initially, bot operators attempt to bypass controls, but when unsuccessful, they often abandon automated attacks, leading to a year-over-year decline. While many industries saw declines in automated attacks, eCommerce, Hospitality, and Quick Service Retail (QSR) experienced increases. Hospitality (+18.3%) and QSR (+11.2%) saw the largest web automation spikes, while mobile API automation rose in QSR (+3.4%) and eCommerce (+2.8%). These increases were driven by determined bot operators whose businesses depended on the ability to automate their activities. None of the increased bot traffic was able to reach the origin servers. An increase in automation attempts is not necessarily indicative of a failure of controls, but rather of an increase in attacker motivation and or sophistication. If, for example, bot operators create a new attack tool or a new fraud scheme for a given industry that they want to leverage, they will try it on target enterprises, resulting in an increase in automation reaching the bot defenses.
Bot sophistication varied between the web and mobile API platforms. Web sites saw just over 24% of automated traffic originating from advanced bots, while only 13.5% of all mobile API transactions came from similarly capable attackers. The reverse was true for intermediate bots. Web sites saw 21.5% of automated traffic coming from these automated clients, while intermediate bots represented 40.0% of activity to mobile APIs (Figure 2).
The sophistication of bots also varies widely across industries. Advanced bots were most prevalent in General Retail, Airlines, and Banking (web platforms), and Telecommunications and Entertainment (mobile APIs).
Effects of enabling bot mitigation varied between platforms. Mobile APIs saw a significant drop in unauthorized automation, with flows seeing a median of 6.11% in monitoring mode, and a median of 0.90% with mitigation enabled. Web traffic saw an unexpected increase in bot activity, though further analysis showed that bot operators increased their automation efforts since their business depended on unauthorized activity such as price scraping. Web flows had a median of 7.04% of all traffic originating from bots while in monitoring only mode, and a median of 7.94% after mitigation. No unauthorized bots were able to connect to origin servers post mitigation.
Credential stuffing, an common cyber attack enabled through the use of malicious bots, continues to be a significant challenge for all industries. With bot-mitigation in place, the attempted level of malicious login attempts across all industries was 10.6% for web traffic, and 5.2% for mobile API transactions. Per-industry, this reached as high as 33.5% of all login traffic targeting the Technology industry on the web, and around 24% against mobile API endpoints in the eCommerce and Entertainment industries. Telecom ranked first for the highest share of advanced credential stuffing bots across all industries and platforms. A full half of all login traffic targeting mobile APIs within the Telecom sector originated from advanced automation sources.
Residential IP proxies have become a must-have for bot operators. By routing their traffic through the networks of home broadband and cellular users, bots are able to benefit from clean and trusted IP addresses, bypassing simple bot defenses that rely heavily on IP reputation checks. The problem is so widespread that recent research claims that virtually every single cellular IP address passes some bot traffic.
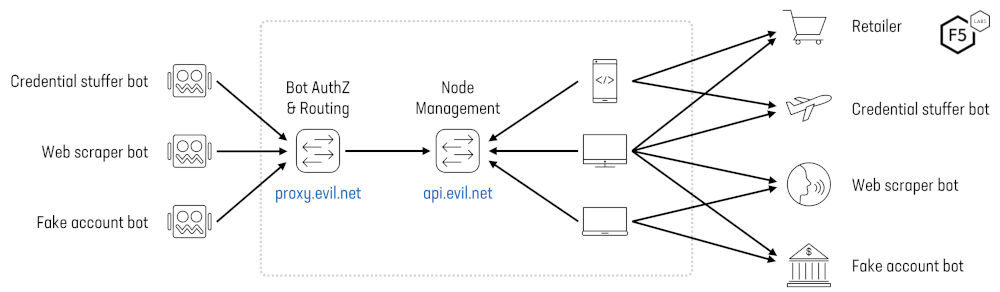
Figure 3: Overview of a residential proxy network architecture.
Bots and automation continue to pose a significant challenge across industries, with web scrapers being the most prevalent threat. Over half of all web content requests came from scrapers, and nearly a quarter of web searches were automated. This surge in scraping activity is likely linked to AI agents from companies like OpenAI, Anthropic, and Perplexity. Reseller bots also remained a major concern, automating more than one in five "add to cart" transactions. While overall bot automation levels have declined compared to previous years—likely due to improved mitigation efforts—persistent scraping and advanced automation attempts continue.
The impact of bots varies by industry, with hospitality, e-commerce, and entertainment being the hardest hit. Interestingly, web-based attacks tend to be of lower sophistication, while mobile API attacks often exhibit intermediate sophistication. Effective mitigation significantly reduces bot-driven transactions, but some persistent attackers continue their efforts, particularly in scraping and account creation. This ongoing cat-and-mouse game underscores the need for businesses to maintain robust anti-bot defenses, as even small lapses can be exploited by automated threats that adapt and retry, potentially leading to increased attack volumes despite mitigation efforts.
Introduction
In today’s online world, bots flood the web. If some reports are to be believed they make up 50% or more of all internet traffic. Not all bots are bad, of course. We rely on bots to crawl and index the web for search engines, such as Google and Bing. We improve efficiency by creating scripts to automate repetitive tasks, such as data backups. Entire businesses are even built based on the use of bots (think price comparison sites and financial aggregators). But for each good bot there are many questionable ones, and a growing number of entirely malicious ones.
Much research already exists which examines the web’s traffic at large, comparing the number of human users to bots and how things differ from one industry to another. This report is different in a few crucial ways.
One such way is the level of detail into which we go when examining the different types of bots and their uses. Automation affects all industries to varying levels, and the types of bots (the objective of the bot operators) can be dramatically different. In the full and unabridged version of this report available at f5.com/labs we provide exhaustive analysis of the various types of bots, their prevalence in each industry, explain the motivation of the bot operators, and even provide guidance and recommendations for countering each of them.
Additionally, we focus on advanced and persistent bots. Threat actors, whether they be nation state or organized crime, often change their behavior once security controls and other mitigation strategies are put in place. Our research shows this is certainly true of bots and their operators. Once bot defenses are activated bot operators often move to softer targets or increase the sophistication of their tactics, tools, and procedures. This report analyses over 200 billion web and API transactions for users of F5’s Bot Defense solution. Most of these users have had this solution in place for many years which means the data we have on bot attacks is heavily skewed towards those operators who are advanced and persistent in their use of bots. The attacks and methods we observe in our data, therefore, showcases the sustained and advanced bots that organizations might encounter even after enabling bot mitigations.
Readers interested in seeing the quantity of bot traffic (such as credential stuffing attacks) against organizations without bot defenses are encouraged to review our 2023 Identity Threat Report. This publication showcases the drastic difference in bot traffic before and after enabling bot controls.
This report analyses bot traffic targeting a wide range of global industries during 2024 (specifically, 12th November 2023 to 18th September 2024). Henceforth, the term ‘automation’ shall refer to any malicious synthetic or non-human traffic reaching a protected application.1
Due to the change in focus of this report compared with the 2024 Bad Bots Review, the list of flows included in the research has been adjusted. This means that while some flows remain the same, others have been broken down into more granular flows so we can better analyze the intent of the automation. An example is the Shop flow as found in previous reports. This has now been split into Shop, Add to Cart and Checkout. This is to allow us to differentiate between bots simply reviewing shopping pages (Shop), those trying to acquire goods at scale (Add to Cart) and carding bots trying out multiple stolen credit cards (Checkout). Details of the changes in the flow definitions can be found in the appendix. |
Impact of Mitigation
In our 2023 Identity Threat Report we examined the impact that bot mitigation had on the quantity and proportion of credential stuffing attacks. We analyzed bot traffic targeting web and mobile APIs and compared figures before and after bot mitigation was enabled for each protected endpoint. As might be expected, we found a significant drop in the proportion of unauthorized automation, as show in Figure 4. This drop off was present across both web and mobile API endpoints, but was more pronounced in mobile API traffic. Pre-mitigation, mobile API automation levels were higher than web. Once mitigation was enabled, mobile API automation levels dropped below those for web. This, despite web also seeing a significant decrease in automation levels post mitigation.
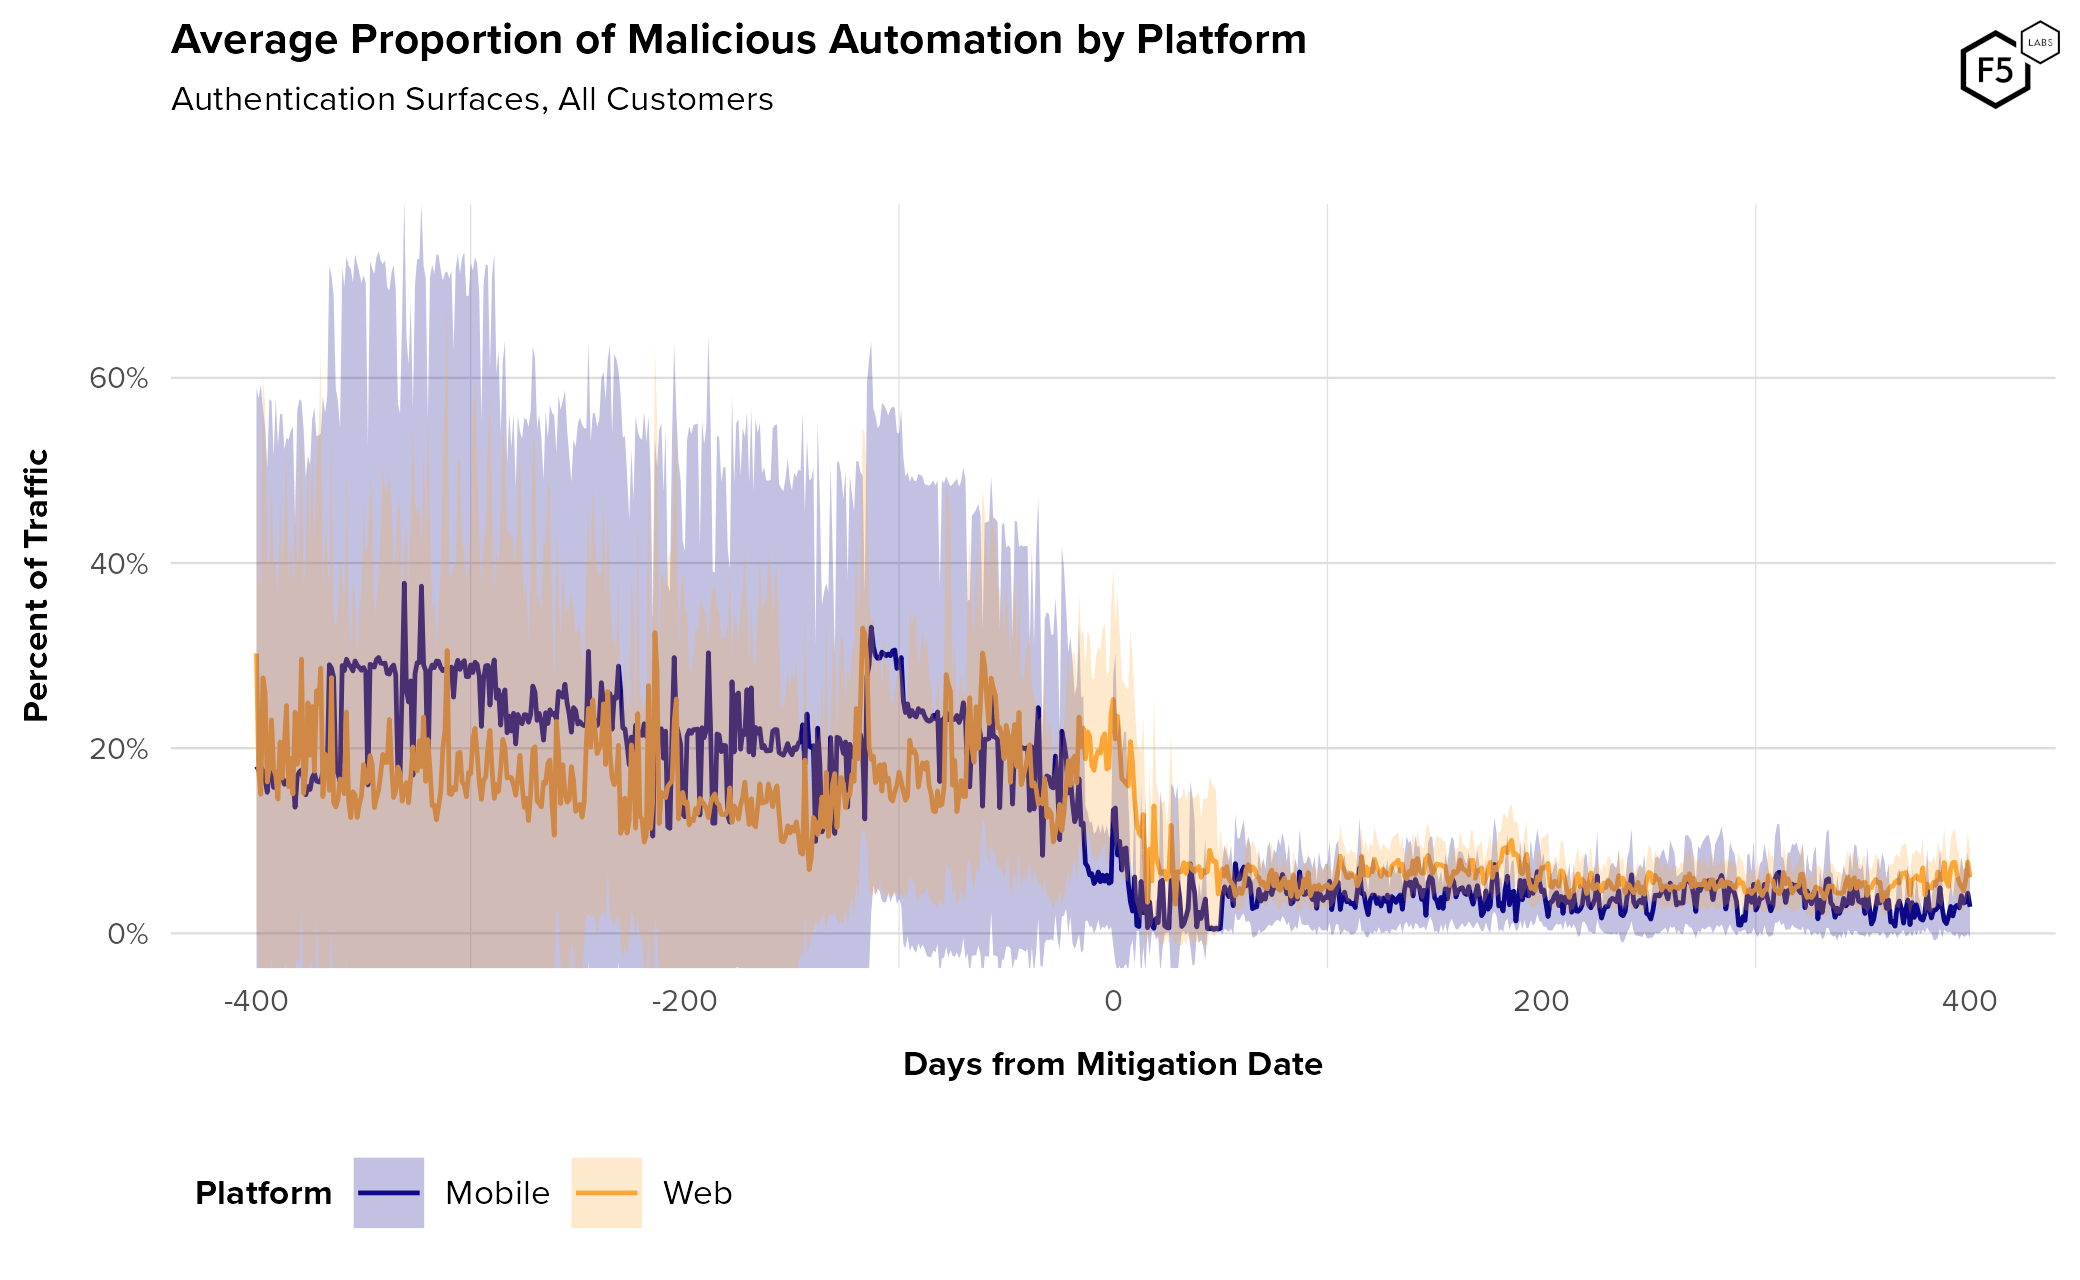
Figure 4: Average rate of malicious automation against authentication endpoints over time, broken out by platform. While mobile endpoints see higher level of automation rates pre-mitigation, web endpoints tend to stay higher post-mitigation.
In this report, we have expanded upon this previous analysis, and look beyond just credential stuffing attacks to examine the effects of bot mitigation on all flows. We continue to split traffic by web and mobile API since our research shows different tools, motivation, and persistence for the different platforms. For this analysis, we only included flows that had substantial quantities of data for enterprises in monitoring-only and in mitigation mode. For these reasons some flows were excluded and the list here may differ from the full list of flows.
More details can be found in the Bot Behavior Post-Mitigation section.
Bot Sophistication
The capabilities (sophistication) of bots are indicative of the level of technical expertise, motivation, and resources that a bot operator can bring to bear in the execution of their automated activities. There is usually a positive correlation between the level of sophistication of an attack and the cost associated with carrying out that attack. Threat actors will generally do the minimum amount required to get a successful result. Hence attacks that start off unsophisticated can quickly retool into more sophisticated attacks depending on the level of technical expertise, motivation and resources the attacker has.
Attack sophistication can be categorized in one of two ways: the capabilities of the tools, or by the techniques used to operate the bots (for example, by cleverly distributing the timing of requests sent by the bots). For the purposes of this report sophistication is limited to the capabilities of the automation tools.
We categorize bots by three levels of sophistication (Table 1).
| Basic | Intermediate | Advanced |
| Basic HTTP level automation that emulates the network traffic of a browser or app but is unable to run JavaScript and or does not use the real mobile application with SDK installed. | Ability to run JavaScript or use the real mobile application with SDK installed to generate tokens which are then manipulated or abused. | Full browser, mobile app and user behavior simulation. Ability to generate valid tokens and device telemetry using real or simulated devices, as well as provide user interactions (keyboard, mouse and touch events). |
| e.g. Python, SentryMBA, Scrapy, WGET | e.g. headless browsers and mobile emulators | e.g. Selenium, Browser automation studio, mobile emulators |
Going With The Flow
Unauthorized automation can serve a multitude of purposes for malicious and unscrupulous actors. Though some malicious automation may be highly bespoke and customized to perform a very specific action against one specific victim, bots are broadly categorized into their intended purpose. We have found the most prevalent to be:
- Credential stuffing bots
- Fake account creation bots
- Automated purchase bots (aka reseller bots)
- Scraping bots
- Carding bots
- Gift card checking bots
- Financial aggregators
While these types of bots are a useful way to consider the intention of bot operators, there can be considerable variety in the way these bots operate and how they target web applications and APIs. For this, we encourage application defenders to consider the ‘flows’ which bots target.
We define a ‘flow’ as an function provided by a web application or API, for example: Login, Sign Up, Search, Shop etc. These are functions that a given application endpoint allows users to perform. Different kinds of flows therefore attract different kinds of attackers, e.g. Login attracts credential stuffing and account takeover; Product Search attracts scrapers, and Shop/Add to Cart flows attract sneaker bots and other reseller bots.
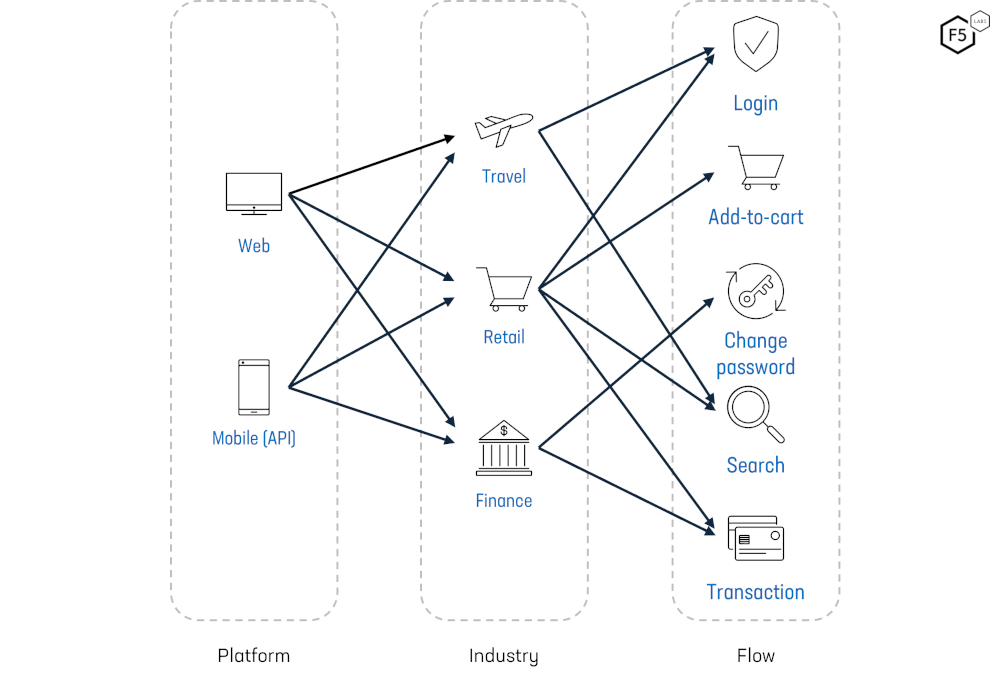
Figure 5: The interaction between Platforms, Industry, and Flows.
In this report, we examine the proportion of unwanted automation and sophistication of the bots which target these flows and how they vary across industries.
A full list of definitions of our definition of the industries and flows included in this report can be found in Appendix 1: Industry Definitions and Appendix 2: Flow Definitions.
Bot Breakdown
Here on in, we divide up the over 200 billion transactions in to various slices to really understand the prevalence, intention, and targets of bot operators. We compare industries, target platforms (web and mobile APIs), and the flow (functions) which they focus on.
Several factors drive the levels of automated attacks across industries: the value of successful attacks, the strength of security defenses, the risk of being caught, and the deterrence from existing protections. High-value industries experience more attacks due to the substantial potential rewards attackers can gain. For example, the ability to steal hotel loyalty points, which can be used or sold for travel perks, makes Hospitality an attractive target. The high payout from these attacks results in higher automation levels in this sector. By contrast, industries with lower potential payouts, such as Insurance, see fewer automated attacks. The limited financial gain from accessing an insurance account, combined with the high risk of legal consequences, makes it a less appealing target for attackers.
The effectiveness of security defenses also plays a crucial role. Sectors with robust security measures and experienced teams, such as Insurance, deter attackers leading to lower levels of unauthorized bot traffic. Newer enterprises, or those with less mature security, however, are more susceptible to automated attacks, as evidenced by industries that have recently implemented anti-bot defenses. Over time, as security defenses strengthen, automation rates tend to decrease but businesses must remain vigilant as attackers continuously adapt to new protection mechanisms.
Top Targeted Industries
We found that bot traffic varied dramatically across industries, and the platform (web service or mobile API) being targeted. For web services, the highest levels of automation targeted Hospitality firms. This industry withstood a staggering amount of bot traffic which accounted for over 44% of all transactions being sent to their applications. This high level of bot traffic was mainly driven by scraping against hotel companies’ rooms and rates flows (Figure 6). The second most targeted on web is Healthcare (32.6%), with eCommerce in third place (almost 22.7%).
Quite a different picture emerges when evaluating mobile API bot traffic. Here, the Entertainment industry takes the unenviable top spot with 23.0% of API traffic coming from unauthorized bots. This is, however, down from 34.5% as reported on in our 2024 Bad Bots Review, which covered data for calendar year 2023.
A dramatic difference can be seen between Entertainment and the second placed industry, eCommerce which saw only 4.5% of mobile API transactions originating from bots.
Industry Trends
The longer bot mitigation is in place, the bigger the impact on bot traffic. To understand the level of impact, we compared the amount of unauthorized bot activity in this report’s data with that of our previous report. This effectively compares bot activity between 2023 and 2024.
Overall most industries saw a decrease in automation targeting both their web and mobile API endpoints. Almost 60% all industry/platform combinations (for example, Hospitality web sites, Entertainment mobile APIs) experienced a decrease in unauthorized bot traffic. The biggest decreases in bots were seen on the web platforms of the Telecoms (18.5%), Healthcare (10%) and Airline (9.2%) sectors. Decreases were also observed on the mobile APIs of the Entertainment and Fashion Retail industries which decreased by 11.5% and 8.3% respectively.
This aligns with the expectation that the longer bot mitigation is in place, the more deterred threat actors will be. When bot operators are blocked, they initially try to retool to find ways around the controls. Failing this, they often cease their automated activities and move on to other weaker targets. As a result, over time we tend to see a decrease in automation from year to year.
Despite many industries seeing a decline in authorized automation with mitigation in place, some found an increase in bot traffic.
eCommerce, Hospitality and Quick Service Retail (QSR) all saw increases in automation across both web and mobile API. The largest web automation increases were seen on the hospitality (+18.3%), and QSR (+11.2%) sectors, while the largest increases in mobile API automation were on QSR (+3.4%) and ecommerce (+2.8%).
Industry Sophistication
Sophistication of bots and automation varies widely by industry and by platform, though it varies more by the former than by the latter. Figure 8 shows the distribution of the sophistication of automation across different industries for web and mobile API traffic.
The highest proportion of advanced web attacks were detected against the General Retail (47.78%), Airline (43.10%) and Banking (37.90%) industries. Targeting mobile APIs, the Telecommunications (50.00%), Entertainment (37.96%) and Credit Union (25.77%) industries had the highest proportion of advanced automation
Another finding was that most mobile API attacks were of intermediate sophistication. Intermediate sophistication attacks made up more than half of attacks in 5 of the 12 industries. Basic attacks were the most common on web with more than half of automation on 10 of the 14 industries (71.42%) originating from unsophisticated bots.
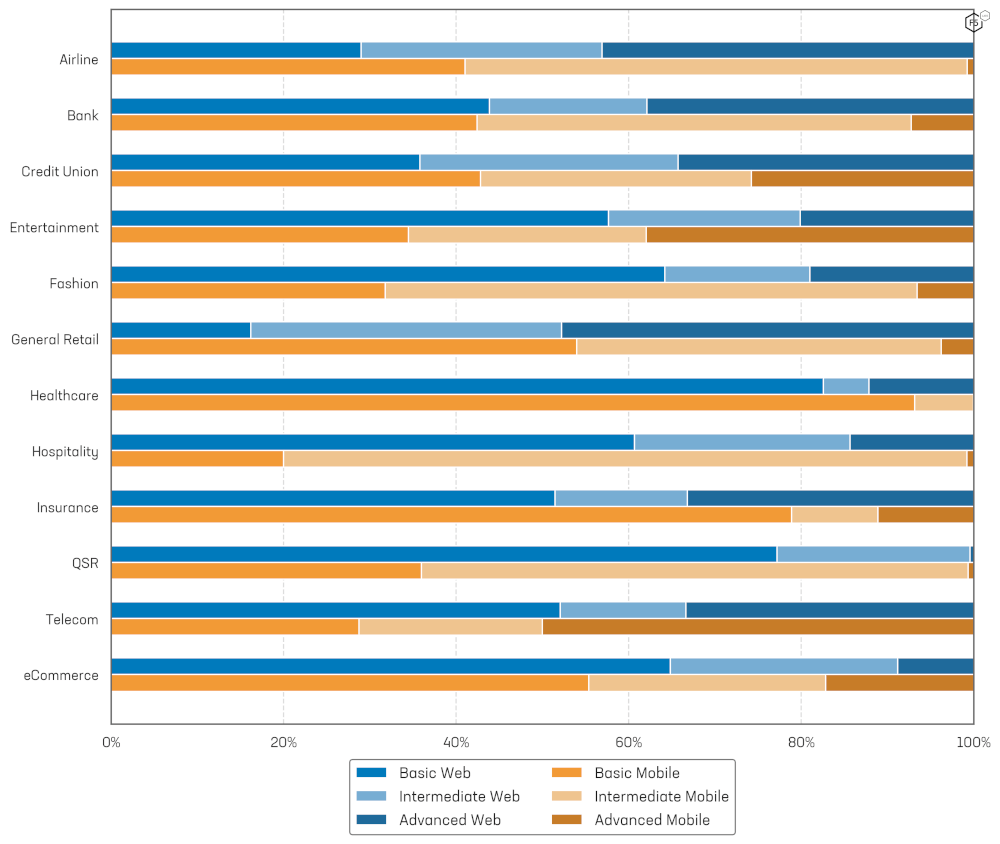
Figure 8: Web and mobile Bot sophistication by industry.
Industry Seasonality
In our 2024 Bad Bots Review we observed significant seasonal fluctuations in automation levels in specific industries such as General Retail and travel-related ones like Airlines and Hospitality. We repeated that same analysis to see if these seasonal trends continued to hold into 2024. This industry seasonal trend analysis was split by industry and by platform (Figure 9).
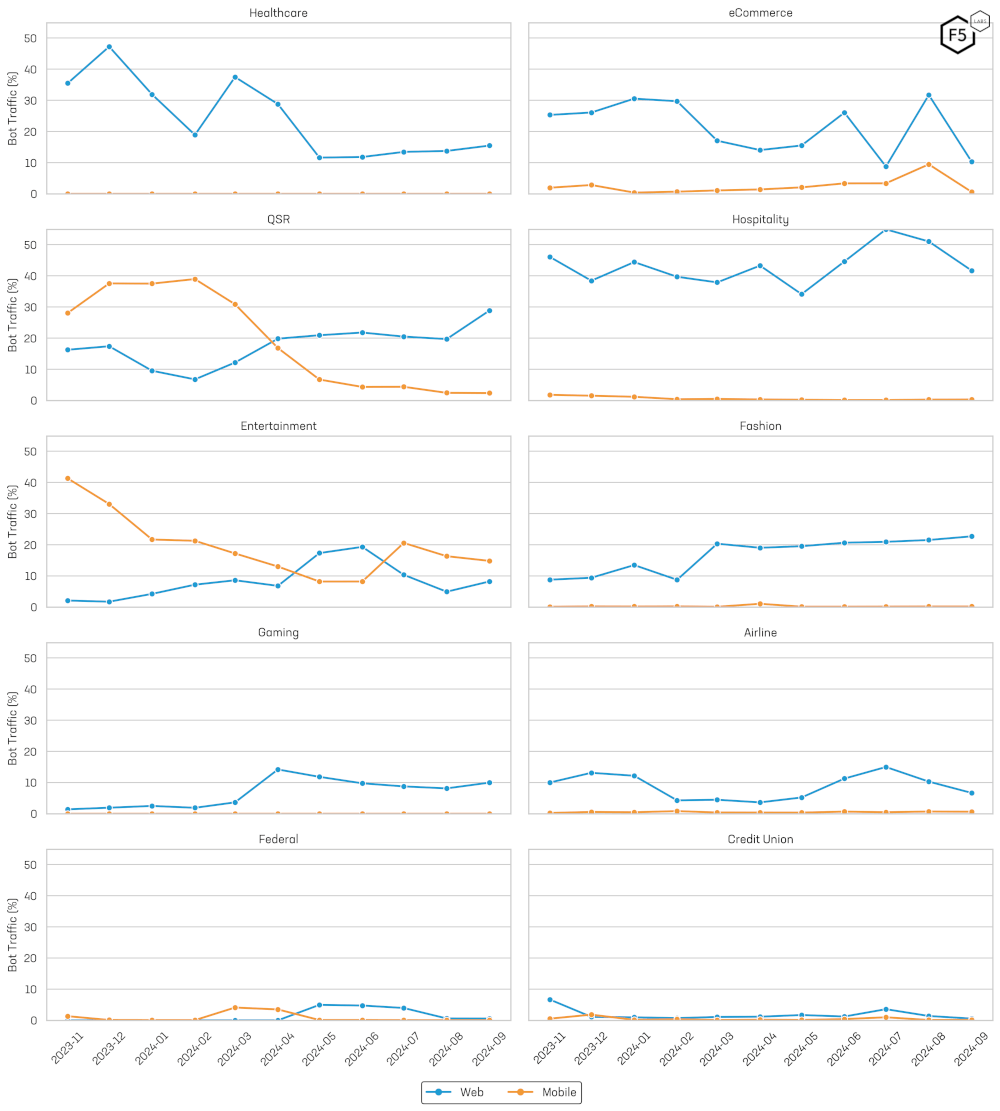
Figure 9: Web and Mobile API Bot Traffic Seasonality.
Web Automation Industry Seasonality
The Hospitality industry maintained high automation rates throughout the period, with a low of 34.01% in May 2024 and a peak of 54.90% in July 2024.
In Healthcare, automation was elevated early on, starting at 35.48% in November 2023 and peaking at 47.24% in December 2023. From that point, there was a steady decline, reaching just 15.48% by September 2024. This pattern is likely due to open enrolment and the end of insurance terms. Insurance customers can generally only update their insurance once a year during open enrolment which tends to happen at the end of the year. Benefits, such as dental and vision, have annual caps that get refreshed every year. For example, an employee may be eligible for one new eye glass prescription or two dental visits per year. Attackers taking over accounts towards end of the year are able to capitalize on these unused benefits. Stored savings on Health savings accounts will also potentially be highest around these times and may or may not roll over into the next plan year, making them a huge target for attackers.
Airline automation showed clear seasonal trends. Initially, for the first three months, levels stayed above 10%, with a notable peak of 13.13% in December 2023. After falling below 5%, automation surged again—rising to 11.28% in June 2024, peaking at 14.99% in July 2024, and remaining elevated at 10.30% in August 2024 before dropping to 6.67% at the end of September 2024. This pattern aligns with typical seasonal increases in travel activity during the summer and year-end periods.
Mobile API Automation Industry Seasonality
In the Entertainment sector, automation peaked at 41.29% in November 2023 before plunging to a low of 8.21% in June 2024, then modestly recovering to 14.82% by the end of the reporting period. The seasonal trend in the entertainment industry seems to be correlated with the major sporting season, starting to increase towards the end of the summer and dropping off significantly after the super bowl in February.
Quick Service Retail (QSR) saw automation levels start at 28.06% in November 2023 and peak at 38.95% in February 2024, followed by a steady decline that brought the figure down to 2.37% by period’s end. It is not clear what was responsible for this trend.
For eCommerce, mobile automation displayed clear seasonal trends. It averaged 1.96% in November 2023 and 2.83% in December 2023, then fell to below 1% before beginning a recovery in March 2024 that culminated in a peak of 9.46% in August 2024. The peaks in automation tend to coincide with the year end and summer-fall shopping seasons and back to school. Figure 6 further illustrates these seasonal trends alongside other industry-specific patterns in mobile API automation.
Top Focused Flows
Web flows generally get significantly higher levels of automation than their mobile API counterparts. This is highlighted in Figure 10. Out of the 17 flow/platform pairs in the analysis, 15 (88.24%) showed this trend. The highest levels of automation on web were detected on the Content, Search, Quotes and Add to Cart. This indicates that the most active bots targeting web endpoints are web scrapers and reseller bots. On the mobile APIs, the most targeted flows are Support, Sign Up and Search.
Figure 10 shows the percentage of automation targeting a select list of flows.
Automation rates are often found to fluctuate from year to year. The highest increase in automation was on web Content flows where scraping of content pages increased +47.7% compared to the 2024 Bad Bots Review’s reporting period (see Figure 11). This increase in web scraping aligns with the rise in AI agents from generative AI companies like OpenAI, Anthropic, Google and Perplexity, though no independent investigation into the source of this increase was conducted. Significant decreases in automation were also detected on web Gift Cards (-13.6%), as well as both web and mobile API Shop flows (-7.6% and -8.7% respectively).
Sophistication by Flow
The level of bot sophistication varies by industry as well as platform (see Figure 12). Advanced automation dominates Ratings flows on the web (91.44%), as bots manipulating user reviews increasingly leverage sophisticated techniques, including Generative AI, to create realistic fake reviews. These bots are designed to bypass both front-end controls and back-end fraud detection systems.
Conversely, 90.48% of web scraping traffic is categorized as basic, as most scraping relies on simple, fast, and resource-efficient GET requests, prioritizing scale and cost-effectiveness over complexity.
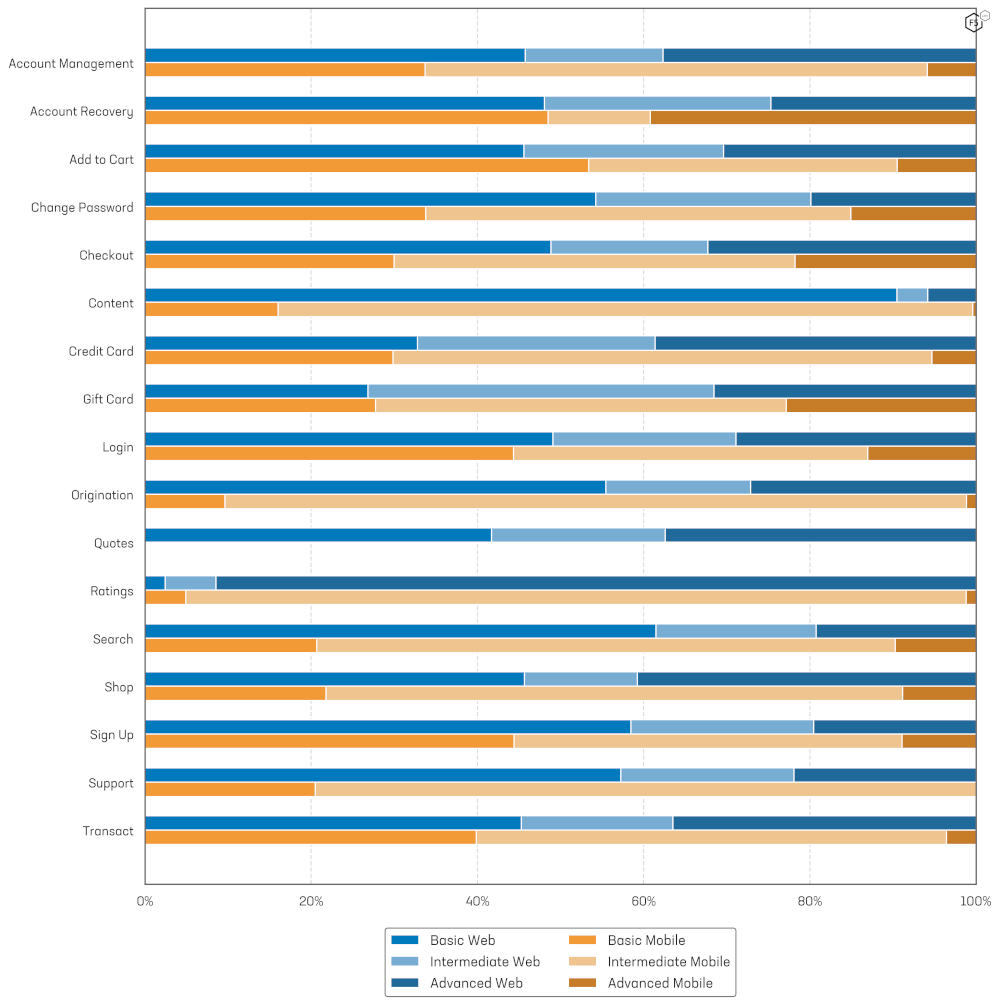
Figure 12: Bot sophistication by flow against Web and Mobile end points.
On Mobile, the flows with the highest proportion of basic automation are Add to Cart (53.40%), Account Recovery (48.50%), Sign Up (44.40%) and Login (44.33%). The flows showing the highest proportions of advanced automation being Account Recovery (39.20%), Gift Cards (22.82%) and Checkout (21.77%). Across all mobile API flows, Intermediate automation made up the majority of traffic detected. This is in line with the findings in the mobile API Industry analysis.
Automation Prevalence by Flow and Industry
Finally, we are going to take a 2-dimensional look at automation prevalence by both industry and flow. To achieve this, we have created a heatmap, shown in Figure 13. This heatmap shows the prevalence of automation for each industry-flow combination. This provides a high-level view of the automation hotspots which are shown in the darker color. The blank cells that show in white indicate no or insufficient data. The results show that reseller bots (add to cart) are a major problem in the ecommerce sector, as are scrapers in State/Local Govt. Scrapers (Search) are a major issue in the healthcare and fashion retail sectors. Credential stuffing (Login) affects almost all industries with varying levels of severity, as do fake account creation bots (Sign Up).
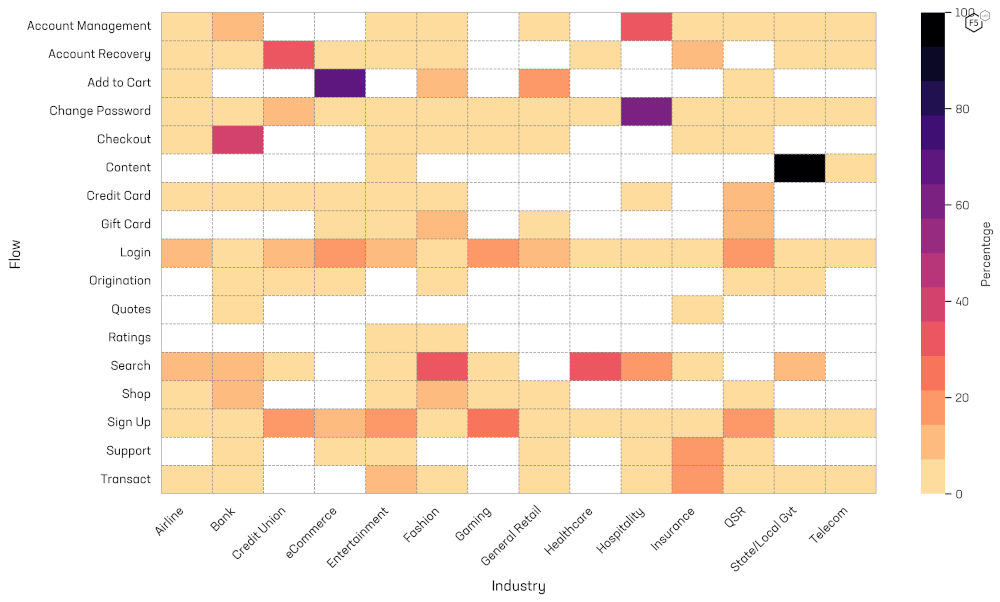
Figure 13: Heatmap of automation prevalence by Industry and Flow.
Bot Behavior Post-Mitigation
Enabling a bot mitigation solution will affect the behavior of bot operators. Many bot operators will re-tool and attempt different methods of attacks. Others will give up and move to easier targets.
This analysis looks at enterprises in monitoring-only and in mitigation modes. This is not necessarily the same enterprise moving from monitoring to mitigation mode, but an average of all enterprises that were in monitoring-only mode over the reporting period, compared to an average of all enterprises that were in mitigation mode. This nuance explains some of the variations observed with web traffic. |
For mobile API traffic, as would seem logical, we saw a significant drop-off in automation levels across all flows once mitigation is enabled. The largest decrease we observed was for the Search flows where unauthorized web scraping accounted for 24.78% of all traffic hitting search pages. When mitigation was enabled, this plummeted to 0.92%. Other flows such as Account Management, Login, and Signup saw equally large declines in bot traffic once mitigation was switched on (Figure 15).
Web traffic post-mitigation turned up some surprising results (see Figure 15). After enabling mitigation most flows saw a rise, not a decrease, in bot traffic! Ten out of the fourteen web flows (71.4%) had higher proportions of unauthorized automation which seems counterintuitive and immediately led to questioning why this might be the case. Are the bot mitigation controls ineffective? Are they blocking legitimate human users? Were the data incorrect?
Upon further analysis it became apparent that the data were indeed correct. What Figure 15 shows are the efforts of bot operators to circumvent the mitigations put in place. Consider that entire business and operating models are built upon the ability to scrape data, prices, and other intellectual property from other companies. Those that depend on bots simply cannot afford to give up when controls are turned on. Instead, these bot operators ramp up their efforts and attempt to find ways around the controls. The increase in bot traffic is evidence of bot operators attempting (and failing) to circumvent the controls.
Some flows did see a drop in unauthorized automation after mitigation was enabled. These tended to be those associated with malicious or criminal activity e.g. Credential stuffing (Login flow), Carding (Credit card) and Account Takeover (Change Password flow). These kinds of bots tend to move on once mitigated and do not tend to persist.
It’s worth noting that none of the unauthorized traffic post-mitigation was able to make it to the origin servers delivering the web and mobile API services.
The Identity Threat
Also known as Account Take Over (ATO) attacks, Credential Stuffing bots are one of the most prevalent threats on the web today. Our previous report in this series, the 2023 Identity Threat Report was subtitled “The Unpatchables” as a way to highlight the danger that weak and re-used credentials can pose. Unlike software or hardware, it’s impossible to quickly roll out a patch to close this vulnerability. Multi-factor authentication can help but is far from fool proof due to the prevalence of real-time phishing proxies, and CAPTCHAs have been long known to be trivial for bot operators to circumvent.
Credential Stuffing and Account Takeover
Credential Stuffing relies on bots submitting millions of known-compromised username and password combinations to login endpoints (flows). Login flows also face other kinds of attacks such as brute force login attempts (password guessing), fake account use (accessing fake or canary accounts where user knows the required password) and Aggregators (applications that have been given the correct credentials by the account owner).
We have found there to be higher levels of credential stuffing against web compared to mobile API endpoints. This is true of all industries save for eCommerce and Entertainment which saw higher levels against mobile APIs than their web counterparts (Figure 16). We believe the reason for this is that APIs tend to be more homogeneous hence attack tools designed for one mobile API can easily be pointed at another. Websites are more customized and, as a result, a web attacker will persist in retooling as they cannot as easily point their bot at another customer without a significant amount of work. In addition, mobile developers have richer signals from the user’s device and more control over their app than a user accessing a website via their web browser. This makes mobile APIs harder for attackers to retool against.
The most targeted industries on web are Technology with 33.5% of all authentication traffic coming from bots, General Retail with 25.7%, and Gaming at 19.6%.
Mobile API endpoints were quite different, with the top three being Entertainment at 24.7%, eCommerce with 23.8%, and General Retail seeing 7.1% of all authentication traffic being from automation.
Please note that some industries and enterprises do not have native mobile apps making use of API calls. Mobile apps using webview are considered web traffic for the purposes of this report. This accounts for some industries having no mobile API data. |
The sophistication of credential stuffing automation varies by industry and platform although, at a high level, most industries see a fairly even distribution of basic, intermediate, and advanced bots.
When drilling down into each platform, some trends begin to emerge.
For web, three industries stood out as having a significantly larger proportion of basic credential stuffing attack: Quick Service Retail (89.55%), State and Local Government (67.79%), and Entertainment (60.75%). Since threat actors rarely expend more effort than is absolutely required, this suggests that these industries are fairly easy picking for credential stuffing bots and the low level of sophistication implies that even modest bot defense strategies will have a big impact on their success rate.
Advanced bots targeting the login flows were most prevalent in the healthcare industry with 49.64% of all transactions coming from unauthorized automation. Hospitality also suffered with 40.21% of transactions originating from advanced level credential stuffing bots. General Retail saw 39.41% of its traffic hitting their Login flows coming from the same source.
Mobile API traffic differed significantly from web traffic. For this platform, Telecom and eCommerce fared the worst. Telecom actually took the unenviable top spot for the highest proportion of advanced credential stuffing bots for all industries and both platforms. An even 50% of all credential stuffing traffic aimed at mobile APIs in the Telecom’s industry were from advanced sophistication bots.
For Mobile, we observed the highest proportion of basic attacks were on healthcare, where 89.69% of credential stuffing attacks were basic. This was followed by insurance with 79.76% and QSR with 55.93%. Intermediate attacks made up the majority of attacks in the airline (88.81%), hospitality (66.92%) and the fashion sectors (62.08%). The telecoms, ecommerce and entertainment industries had the highest proportion of advanced attacks. Ecommerce had one of the highest proportions of advanced attacks across both web and mobile API, with 44.82% of mobile credential stuffing being advanced.
The Rise of Residential Proxies
Bot operators know that widely-available defenses against their activities include rate-limiting or management of traffic on the basis of IP address or related enrichments. Many organizations use IP reputation databases to block connections from addresses associated with spam, scanning, malware, botnets, or other malicious activities. These databases are continually updated, enabling defenders to block risky connections by source IP. Security teams may also restrict connections based on IP geolocation. For example, a U.S.-based retailer might choose to block traffic originating outside North America. Additionally, connections from non-residential sources like cloud hosting, TOR exit nodes, or VPS networks may be flagged as suspicious. Legitimate users are expected to connect from residential blocks of IP addresses assigned to home broadband or cellular users.
To bypass these controls, bot operators require access to a large pool of trusted IP’s with good reputations. Specifically, they look for IP’s sourced from home broadband and mobile phone service providers. This provides them with a significant advantage against any bot defense relying significantly on IP address to identify bad actors.
Hiding in Plain Sight
A thriving market for residential proxy networks has emerged to supply the demand for clean and non-suspicious IP addresses. “Proxyware” is installed on mobile devices, desktop computers, laptops, and even IOT devices and home routers, enabling bot operators to proxy their traffic through these compromised devices, leveraging the trusted home IP addresses to mask their activities.
The basic process of building out and making use of a residential IP proxy network is shown in Figure 19 and described below:
Step 1. A residential proxy owner (evil.net) builds out their network by enticing or tricking users into installing “proxyware” on to their devices. These end user devices become nodes in the evil.net proxy network. They ‘call home’ to api.evil.net to register their availability and establish control channels with the proxy network.
Step 2. Bot operators, wishing to scale their activities while evading IP-based bot defenses, subscribe to evil.net services and configure their bots to use the frontend gateway proxy.evil.net as an HTTP or SOCKS proxy. The bots send connection requests to the proxy along with proxy authentication information and geo-targeting and session id/duration constraints.
Step 3. For each connection request the proxy network selects a network peer matching the given geo-targeting and session constraints and instructs the peer to establish a tunnel to the targeted destination.
Step 4. Through the established end-to-end connection, the bot performs a TLS handshake with the targeted destination site and makes HTTP requests over the encrypted tunnel.
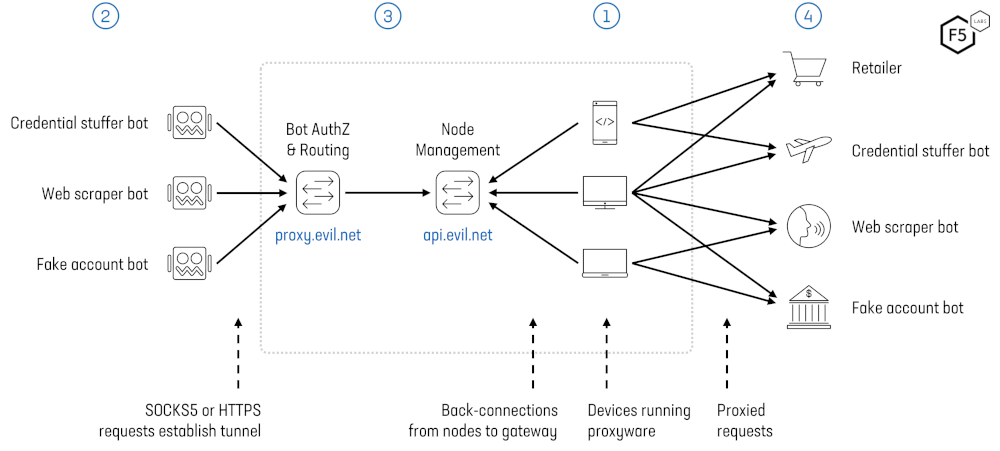
Figure 19: Residential Proxy Network Architecture.
To the target websites, the traffic appears to originate from many high-reputation residential IP addresses associated with the nodes, enabling the malicious traffic to bypass IP reputation and rate limiting controls.
Proxyware is installed in a number of ways. In some cases, device owners voluntarily install proxyware, enticed by the promise of revenue sharing from the proxy network. More commonly, proxyware is hidden within other software the user is persuaded to install, such as free VPN clients, video streamers, or browser plugins. In some cases, proxyware is used to monetize malware that the hapless user is completely unaware of. In these cases, the device owner is unaware that they are enabling their device (compromised device) to relay malicious traffic. Some residential proxy networks advertise "ethically sourced IPs," claiming they use only voluntary member devices and not compromised ones. This is marketed as a unique selling point to attract customers, such as price scraping aggregators, who wish to avoid using illegally compromised devices. However, our research suggests that the majority of proxy installations occur without the informed consent of the device owners. |
F5 researchers have studied and monitored over twenty distinct families of proxyware and supporting infrastructure that supply residential proxy networks, globally. These networks, as we will show in the example of The LumiApps/AppMonetize Residential Proxy, have significant marketing campaigns to advertise their services, lauding their scale and ease of use. While many proxy networks advertise they have upwards of 100 million nodes, such marketing claims are difficult to substantiate. Our research corroborates the common finding that the practically addressable IP pools these networks are smaller than advertised. Probing a large network can reveal tens of millions of IPs over long spans of time, but on any given day the reachable figure of even the largest networks is a few million at best, even with the most inclusive geo-targeting and IP rotation, a capacity that is nevertheless quite adequate for most large-scale bot operations.
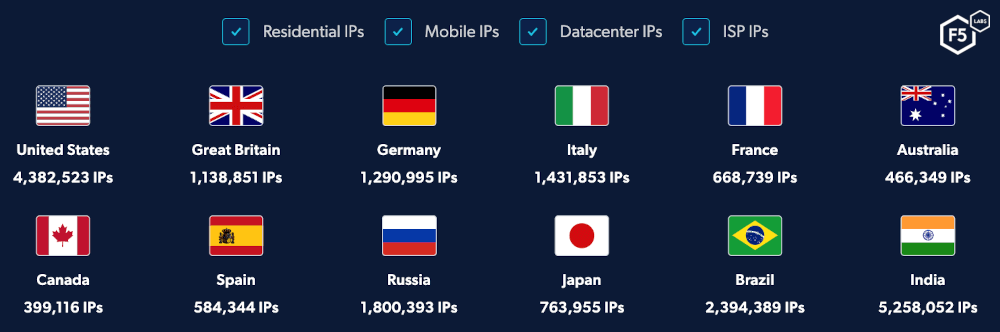
Figure 20: A screenshot taken from a residential proxy network supplier, showing the type and geolocation of IP addresses it offers.
Reselling Proxy Networks
The market for residential proxy networks is highly developed and layered, yet opaque. For every proxy network supplier who owns and operates the infrastructure supported by one or more families of proxyware, there are often numerous resellers and demand partners, or even numerous sites with different branding that are owned by the same network. While some demand networks may work exclusively with a single proxy provider, many will aggregate services from multiple providers. These resellers market proxy services as tools for regular internet users to conceal their identity and location, maintain privacy, and avoid scrutiny, further broadening their appeal and accessibility.
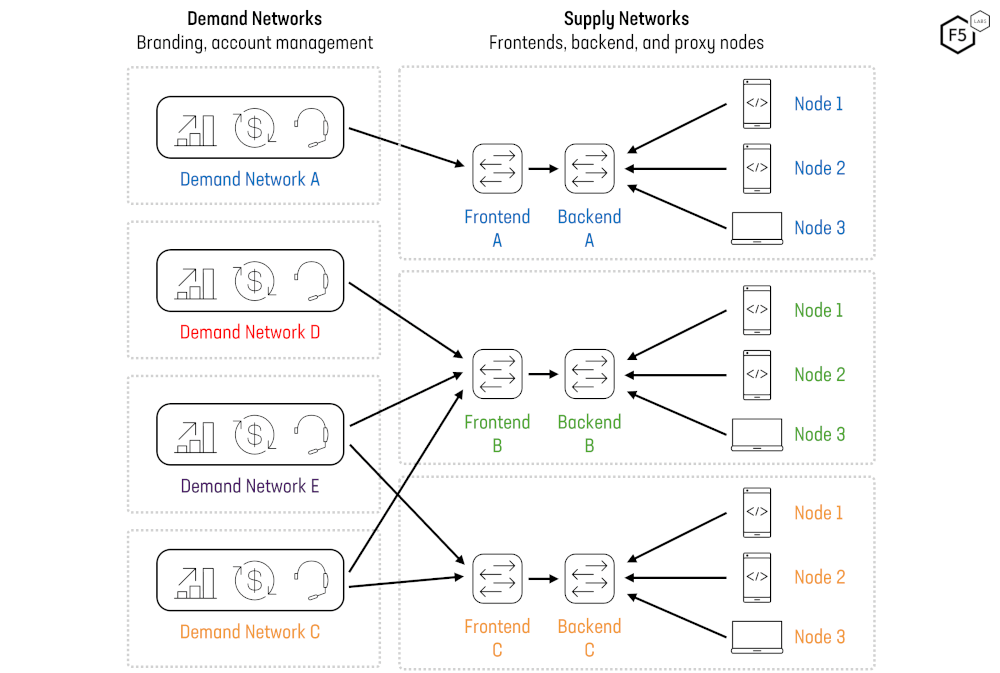
Figure 21: Residential Proxy Network Ecosystem.
Figure 21 provides an illustration of the varieties of supply and demand relationships we have observed in the residential proxy network ecosystem.
Network A is representative of a fully integrated network with its own supply and its own retail sales and branding.
Network B is an example of a supply network which does not sell directly to end users and, instead, relies on demand partners D and E to resell its services.
Networks D and E are example of proxy companies that do not own their own supply and only resell access to the networks of others.
Finally, Network C is an example of an integrated network with its own supply and demand that nevertheless resells access to other networks to augment its proxy pools or product lines.
While many residential proxy networks have questionable sourcing, transport plenty of abusive traffic, and advertise their services in venues associated with abusive use cases, they nevertheless operate very much in the open with all the trappings and functions of normal businesses. They present professional websites that describe benign use cases and that do their best to dispel any concerns their users (or their peers) may have suspicious sourcing or proxy usage. The larger proxy providers and resellers have all the usual functions of any legitimate business such as sales, marketing, HR, engineering, and responsive technical support services.
F5 researchers have spent the last few years studying, mapping, and infiltrating, many of these proxy networks to get a better understanding of how they work, to identify the devices and IP addresses associated with each at any time, and to understand and monitor the traffic that transits these networks in the wild. This information provides valuable additional context as part of a comprehensive bot or fraud defense.
PROXYLIB
To better illustrate the common sourcing approach of inserting proxyware monetization SDKs into mobile apps, we'll explore a highly visible and accessible example that goes by many names.
In March 2023 Integral Ad Science (IAS) discovered a popular free Android VPN application (Oko VPN), which was surreptitiously enlisting users' mobile devices into a proxy network employed in widespread ad fraud. IAS collaborated with Google on the removal of the app from the Play Store in March and then wrote an article about their findings in May. Following the IAS article, researchers at Spur.us investigated further and established connections between Oko VPN, its proxyware SDK provider (LumiApps.io), and a residential proxy service (NexusNet.io) where access to the network was sold.
In March 2024, having dug still deeper, the HUMAN Security Satori Threat Intelligence Team reported on the detailed operation of the SDK, which Satori dubbed PROXYLIB for the core library it contained. Satori identified another 28 apps that employed the SDK and explored the terms and offering of LumiApps.io, a service allowing anyone to repackage an Android app to integrate their monetization SDK with just a few clicks. While LumiApps did provide developers a way to integrate its SDK during development, most of the apps Satori found were modified versions of legitimate apps that had been repackaged by parties other than the original developer and redistributed with the goal of earning revenue share from Lumiapps. Furthermore, while LumiApps provided the option to display a consent screen informing users that their device would be used to proxy traffic, none of the apps that Satori were using it.
The proxy network arising from devices running apps that integrate the LumiApps SDK is what we have termed a "supply network", but LumiApps did not sell access to its network under this name. During their investigation Satori found that access to the network was sold instead through NexusNet alias Asocks (asocks.com). Satori further found that Asocks and LumiApps likely have the same beneficial owners.
Following the Satori investigation Google removed the additional 28 apps from the Play Store and ensured that Play Protect detects and warns users about the PROXYLIB SDK. Subsequently, the name lumiapps.io stopped resolving, but the site re-emerged as appmonetize.net, offering substantially identical services backed by the same SDK, and indeed, more recently AppMonetize has rebranded again, now as APKM.org.
Figure 22 below illustrates user's dashboard during the AppMonetize period, showing the ability to upload and instrument an app and to track usage and earnings over time.
Figure 22: AppMonetize dashboard allowing user to upload apps and view their income based on proxied traffic.
The AppMonetize site claimed that their “…SDK utilizes a minimal amount of the user's Internet connection to anonymously download public available web pages from authorized websites in the background, aiding prominent universities in their online research.”
The SDK offered the user of the app a choice to accept the use of the SDK, presenting a one-screen offer to accept or decline the SDK terms, which grants the SDK the right to “access websites from time to time through your device”. At best, this is somewhat misleading. At worst, this is deceitful.
This is quite typical of the sort of advertising and offers that residential proxy network providers and resellers use to deceive both their customers, the application developers, as well as the users of the apps with installed SDKs.
We have also followed the supply and demand components of the PROXYLIB ecosystem, monitoring both the proxyware and the traffic it transports as well as the distribution of proxy peers from the demand side.
Over time the ecosystem has been revealed as a veritable rat king with:
- one beneficial entity that has developed multiple versions of proxyware SDKs;
- where the SDKs have been distributed through at least three public APK repackaging services (LumiApps, AppMonetize, APKM);
- which together have enabled the distribution of thousands of repackaged apps;
- which have used command and control(C2) infrastructure that has employed at least 7 primary domain names; and
- where access is sold through at least 6 different re-brandings of the same proxy service (asocks.com, ake.net, blackproxy.io, nexusnet.io, sx.org, any-page.io).
F5 researchers continue to track residential proxy networks and their attempts to evade bot defenses.
Conclusions
Bots and unwanted automation continue to shape the online threat landscape, with web scrapers and reseller bots dominating attack flows. From the more than 200 billion HTTP requests sent to enterprises protected by F5 Bot Defense, some key trends stood out.
Flow Attack Prevalence and Trends
Web scrapers were the most predominant type of bots observed during the reporting period. More than half of all web content page requests came from scrapers, and almost a quarter of web searches were from those same bots. Scrapers were also active on the quotes pages of insurance providers and retail product pages among many others. Reseller bots were the second most predominant, especially on web, where more than 1 in 5 add-to-cart transactions were automated.
Compared with our previous report, the 2024 Bad Bots Review, most flows saw a decrease in automation percentages, in line with the trend observed across industries. There was however a significant increase in content scraping which is likely linked to increased activity from AI agents from large language model companies like OpenAI, Anthropic, Perplexity, and others
Industry Attack Prevalence, Trends and Seasonality
Web sites get significantly more automated attacks than mobile API across most industries. Hospitality, Ecommerce and Entertainment are the top 3 most attacked, with Insurance, Credit Unions and Telecommunications being the least attacked. Automation levels in this report are lower than those in the 2024 Bad Bots Review across most industries and across both web and mobile API. Automation levels tend to trend down over time for enterprises with bot controls in place (which most customers in this report are), as attackers give up and defenses are hardened.
The prevalence of bots and automation tends to show some seasonality across different industries’ web and mobile API flows. Airlines and hospitality (hotels) exhibited the most seasonal patterns on Web, with entertainment, QSR and ecommerce showing similar patterns on mobile API.
Sophistication
The level of sophistication of bots and automation tends to vary widely by industry and by platform, though it varies more by the former than by the latter. On Web, most industries faced predominantly basic sophistication bots, while on mobile API attacks tend to be of intermediate sophistication. From a flow perspective, most web attacks were also of basic sophistication, however 91.44% of automated web ratings were from advanced bots. On mobile API, similar to the industry analysis, most mobile API flows experienced predominantly intermediate sophistication.
Impact of Mitigation
Bot mitigation is highly effective, with the overall proportion of transactions from bots decreasing significantly once effective bot controls are put in. It was observed, however, that not all flows experienced a decrease in automation once mitigation was enabled. Targeting mobile APIs, all flows observed a marked decline in automated attacks post-mitigation. However, on versus web, 57.1% of flows actually saw an increase in automation once mitigation was enabled. This was mainly associated with persistent bot operators that double-down on their efforts, evolving their attacks, and retrying their transactions many thousands of times post-mitigation. This retrying of transactions led to an increase in automation post-mitigation rather than a decrease. It is important to note that this increase was only observed by the bot defense controls and not by the origin server, as none of the bot transactions made it through to the origin. This increase in web automation was primarily associated with scraping, reseller and fake account creation bots.
Recommendations
Bots and automation are here to stay. With the rise of AI agents, even more of the traffic to web and mobile API applications will originate from non-human sources. It is therefore important for enterprises to get a handle on this issue and have robust controls in place to secure themselves and their customers. To this end there are several recommendations that we can make to assist.
To summarize the overall recommendations. As security and business leaders, you will need to do the following:
| No. | Recommendation Description |
| 1 | Familiarize yourself with the various methods used to manage bots and automation, and the relative pros, cons and long-term efficacy of each. See the Bots and Automated Attacks page on F5 Labs for more information. |
| 2 | Understand the risk posed to your enterprise by bots and automation by looking wholistically at your enterprises’ attack surface. Review automation prevalence frameworks that provide rules of thumb to evaluate how much of a risk your enterprise faces from various kinds of bots and automation. |
| 3 | Establish a risk appetite for the organization for bots and automated attacks. This will determine the level of risk that your organization is willing to accept with respect to each of the kinds of bots and automation they are exposed to. |
| 4 | Determine a budget for the organization to deal with these risks. This funding will cover the internal human resources, infrastructure, tools and external vendors to address the risk exposure. |
| 5 | Create a risk management strategy to limit the enterprise’s risk exposure and bring it in line with risk appetite. This will include what controls will be implemented to deal with different kinds of bots and automation. For some, non-technological controls may be used, for some, lower cost solutions, and for the most important risks, more expensive high-tech solutions will be implemented. |
| 6 | Implement the bots and automation risk management strategy. |
| 7 | Continuously review performance of risk management strategy and its underlying controls. Make adjustments where necessary to ensure that risk is maintained within the enterprise’s risk appetite, and that controls are working as designed and expected. |
Further Reading
- From Bots to Boardroom: How Bad Bots Negatively Impact Your Balance Sheet – This F5 white paper looks at the business impacts from bots, enabling you to make that pitch to your stakeholders on why its important to mitigate bot activity.
- 2025 Advanced Persistent Bot Report: Scraper Bots Deep-Dive – This F5 Labs companion piece to this report takes a closer look at scraper bots and their impacts across industry verticals.
- The Bots Pyramid of Pain: A Framework for Effective Bot Defense – Another F5 Labs companion piece to this report examines the various methods of defending websites and APIs against automated bots, with a focus on the impact to the bot maintainer.
- The 2024 Bad Bot Review – The direct precursor to this report, covering data from the entirety of 2023.
Appendix 1: Industry Definitions
Airline: Companies offering passenger air transportation services to members of the public
Bank: Financial institutions registered as retail banks
Credit Union: Financial institutions registered as credit unions
eCommerce: General grocery, supermarket, big box and other (non-fashion and non-food only) online retailers
Entertainment: Online entertainment service companies offering streaming, discovery and ticketing of entertainment services
Fashion: Companies selling all forms of clothing, shoes and other apparel
Gaming: Companies offering digital, software or computer gaming services and platforms
General Retail: Businesses associated with online grocery, department or big box retailing
Healthcare: Enterprises that provide medical services for humans and animals, pharmaceuticals, health and wellness. Includes businesses that provide funding, insurance and support services
Hospitality: Organizations offering short term accommodation services e.g. hotels
Insurance: Short-term, long term and health insurance organizations
State/Local Govt: State and local government departments and agencies
QSR (Quick Service Restaurant): Fast food and other food and beverage delivery services
Telecommunications (telecoms): Businesses that provide, internet, telephony, cellular and related services
Appendix 2: Flow Definitions
Account Management: Post authentication endpoints used to manage and maintain a user accounts, including updating personal information, security and privacy settings, communication preferences etc.
Account Recovery: Endpoints that allow users to recover their account if they have forgotten their account details (primarily account name or email address)
Add to Cart: Endpoints associated with adding selected products of service to the cart or shopping basket
Change Password: Endpoints that allow users to change their authentication credentials (primarily passwords)
Checkout: Endpoints for completing an online purchase including shipping and payments
Content: Endpoints on content platforms dealing with the consumption, uploading, downloading, removal, commenting, liking, abuse reporting etc.
Credit Card: Endpoints dealing with credit cards i.e. applying for, cancelling, increasing limits, making repayments etc.
Gift Cards: Endpoints dealing with the purchase, redemption and balance checking of gift cards and vouchers
Login: Endpoints used to authenticate registered users into the system and grant them access to their accounts.
Origination: Endpoints dealing with the opening of financial services accounts including the KYC (know your customer) verification processes
Quotes: Endpoints used to obtain insurance quotes by inputting user details
Ratings: Endpoints used for providing product or service ratings or reviews
Search: Deals with features allowing users to find content, products, services or site/app features via a text, voice or other search feature
Shop: Endpoints dealing with the purchase process for goods and services including adding to cart, updating shipping details, making payments, processing returns etc.
Sign Up: Endpoints allowing users to create new accounts, setup username, passwords and MFA
Support: Endpoints used to obtain customer support via the submission of tickets, chatting with support personnel or systems
Transact: Endpoints used to transact on a website and app on whatever that site or app was designed for, e.g. placing bets on a gambling site, watching a TV show on a streaming app, sending and receiving money on a money transfer app etc.