As we discussed in How to Improve Visibility in Kubernetes, one of the top challenges for app development and delivery teams is getting insight into app performance, security, and availability. These insights help teams troubleshoot problems quickly and proactively prepare for traffic spikes.
Traffic management tools – such as load balancers, reverse proxies, API gateways, and Ingress controllers – generate a wealth of information about your app and infrastructure health. You can track these valuable metrics in real time on the NGINX Plus dashboard, and NGINX Plus can also feed metrics to third‑party monitoring tools to give you extra insight from visualizations of performance over time. Two of the most popular tools work together to give you these time‑series graphs:
- Prometheus – An open source project of the Cloud Native Computing Foundation (CNCF) for monitoring and alerting
- Grafana – An open source visualization and analytics tool that generates graphs and other visualizations from time‑series databases such as Prometheus
The Prometheus-njs module makes it easy to feed NGINX Plus metrics to Prometheus and Grafana. It uses the NGINX JavaScript module (NJS) and the NGINX Plus API to export metrics from NGINX Plus to the Prometheus server.
In this video demo, we cover the complete steps for setting up NGINX Plus, Prometheus, and Grafana, and building Grafana graphs.
 
To help you set up your own implementation, we summarize the steps in the following sections, mapped to timepoints in the video:
- Prerequisites
- Set Up the NGINX Plus Server (1:20)
- Set Up the Prometheus Server (5:30)
- Set Up the Grafana Server (9:15)
- Create NGINX Plus Graphs in Grafana (11:15)
Notes:
- These instructions rely on the NGINX Plus API, and so do not work for NGINX Open Source.
- To use Prometheus and Grafana with NGINX Ingress Controller, see our documentation.
Prerequisites
Before beginning the demo, we satisfied the following prerequisites.
- Install NGINX Plus on the NGINX Plus server. For the purposes of the demo, we’re doing a clean initial installation. If you’re using an existing NGINX Plus server, you might need to modify the changes made to configuration files during the demo.
- Install the NGINX JavaScript (njs) module on the NGINX Plus server.
- Install the latest version of Docker on the Prometheus server. In the demo, we follow common practice and run Prometheus on a second server, separate from NGINX Plus.
- Install the latest version of Docker on the Grafana server (in the demo, a third server).
Set Up the NGINX Plus Server (1:20)
- Install the Prometheus-njs module. We’re using Ubuntu 20.04 in the demo, and this is the appropriate command. For other operating systems, see the documentation.
- Using your preferred text editor, open /etc/nginx/nginx.conf and add the following
load_moduledirective in the top‑level context, outside thehttpblock. - (Optional) Increase the size of the buffer for storing response bodies from subrequests (the default size is 4 KB or 8 KB, depending on the platform). This prevents
toobigsubrequestresponseerrors , which appear in the NGINX error log. Add the followingsubrequest_output_buffer_sizedirective in thehttpblock.
- Save nginx.conf and run this command to verify that the NGINX configuration is syntactically correct.
- Change directory to conf.d and list the files.
- The default.conf file defines a virtual server that listens on port 80. The virtual server for Prometheus needs to listen on that port, so remove default.conf to free it up.
- Using your preferred text editor, create a new file called prometheus.conf, with the following contents. The
js_importdirective specifies the location of the NGINX JavaScript code that converts the metrics generated by the NGINX Plus API into the format required by Prometheus. (You do not also need to add aload_moduledirective for Prometheus-njs.) The firstlocationblock provides access to the Prometheus-formatted metrics. The secondlocationblock enables the NGINX Plus API, which generates the raw metrics and exposes them to Prometheus. Note: In production environments, we strongly recommend restricting access to the NGINX Plus API as described in our documentation. For more information about the Prometheus-njs module, see our documentation. - Save prometheus.conf, check for correct syntax as in Step 4, and run this command to start NGINX Plus.
Set Up the Prometheus Server (5:30)
- Create a new YAML‑formatted Prometheus config file called prometheus.yml in the /etc/prometheus directory, with these contents (based on a default config file from the Prometheus website). As shown, the one change to make is to add the IP address and port of the NGINX Plus server in the targets field. For details about Prometheus configuration, including more options you can include in the configuration file, see the Prometheus documentation.
- Save prometheus.yml, then run the following command. It pulls Prometheus from Docker Hub and exposes it on port 9090.
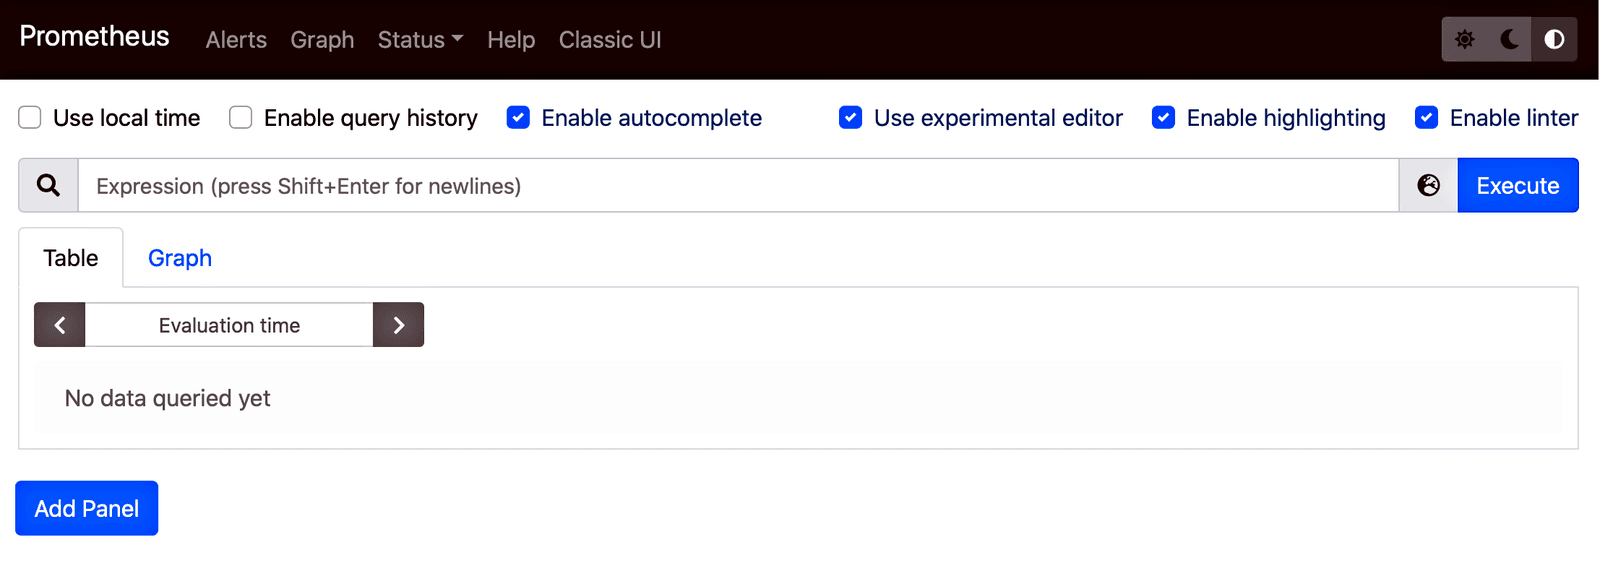
- In a browser, navigate to the IP address and port of the new Prometheus server. A page like the following confirms that the server is working.
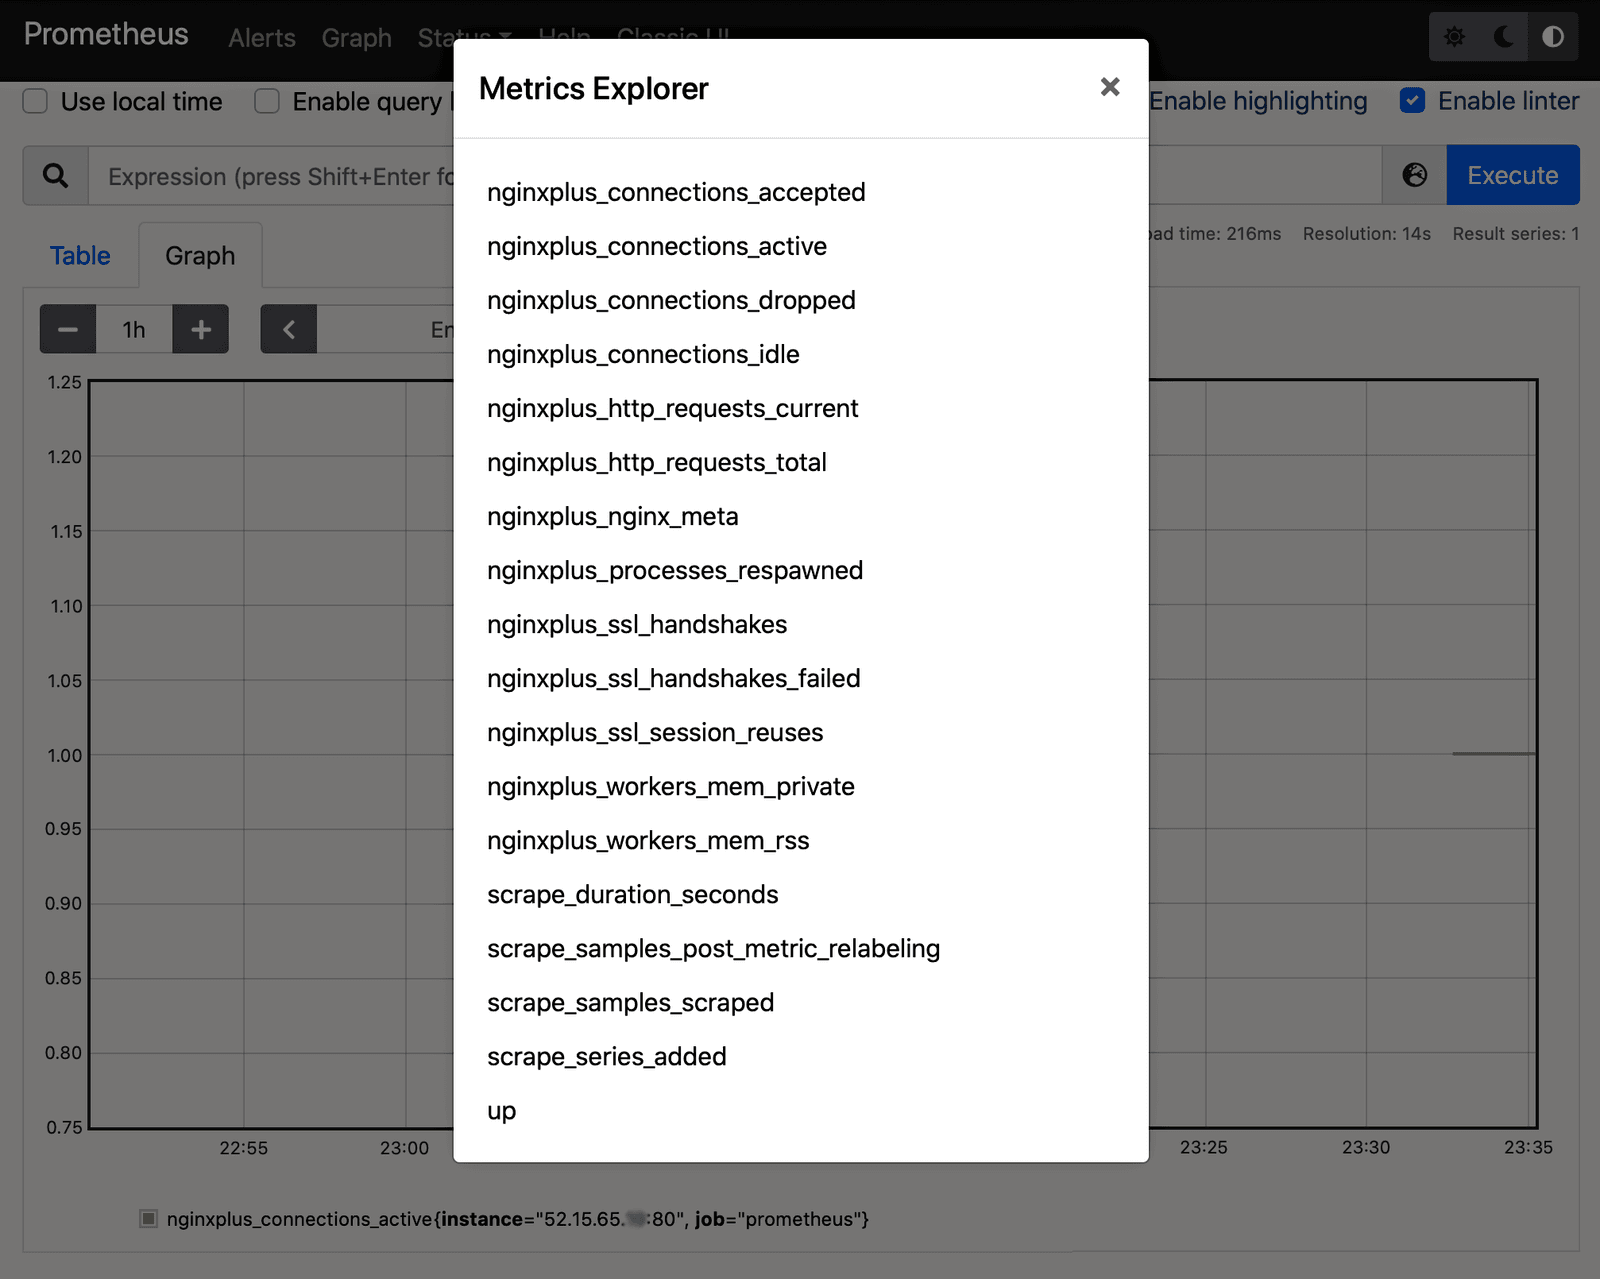
- Verify that Prometheus is accessing the feed of NGINX Plus metrics. Click the globe icon to the left of the Execute button in the upper right corner of the window. A list of metrics like the following appears.
Set Up the Grafana Server (9:15)
- Run this command to pull Grafana from Docker Hub and expose it on port 3000: For other installation methods, see the Grafana documentation.
- In a browser, navigate to the IP address and port of the new Grafana server. The Grafana login page confirms that the server is working.

- Log in by entering admin in both the Email or username and Password fields. We strongly recommend that you set a new secure password as prompted, but we skip that step in the demo for the sake of time.
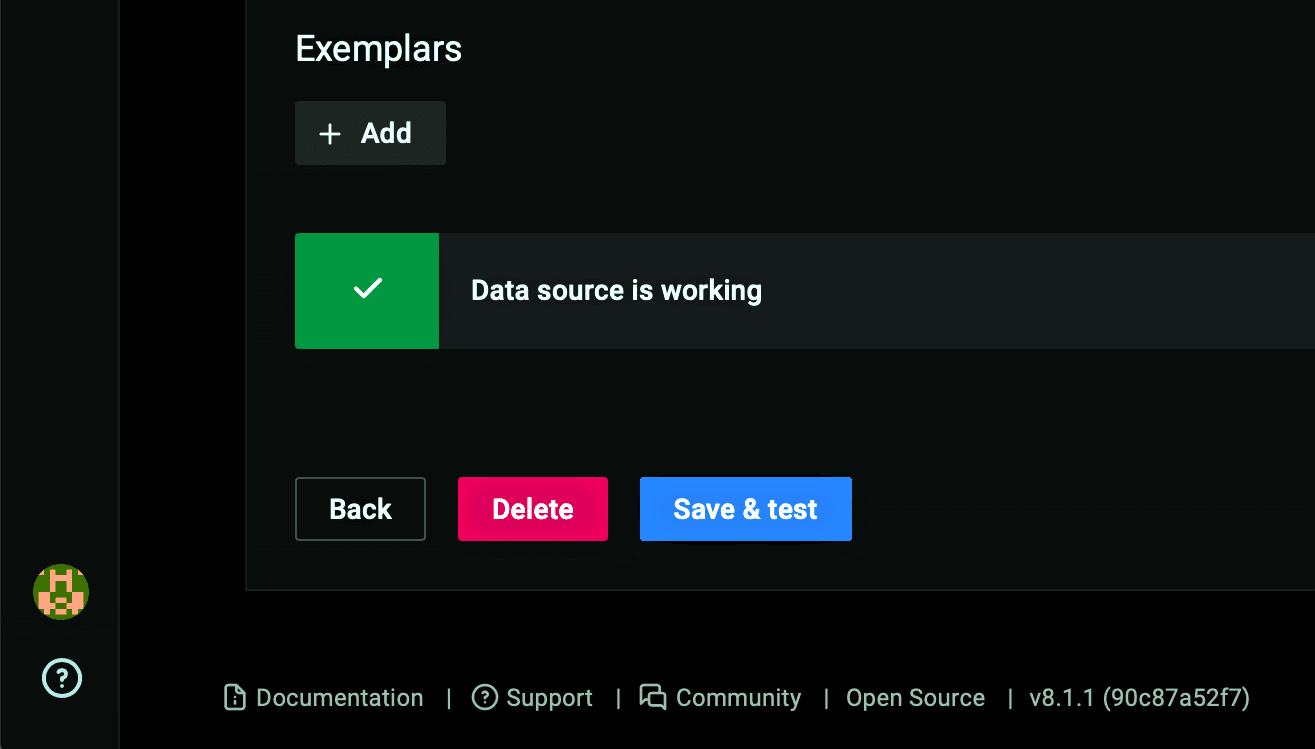
- On the Grafana homepage which appears, register Prometheus as a data source by following the instructions in the Grafana documentation. The video shows the steps in the Grafana GUI. Note: In Step 5 of the Grafana instructions, instead of the URL example shown (http://localhost:9090) enter the IP address of your Prometheus server (and port 9090). After you click the Save & test button in Step 7 of the Grafana instructions, the green box with a checkmark and the Data source is working message indicate that Grafana has successfully connected to the Prometheus server.
Create NGINX Plus Graphs in Grafana (11:15)
While Prometheus is useful for looking at just one metric, Grafana makes it easy to look at a collection of metrics on a single graph.
To build a Grafana graph:
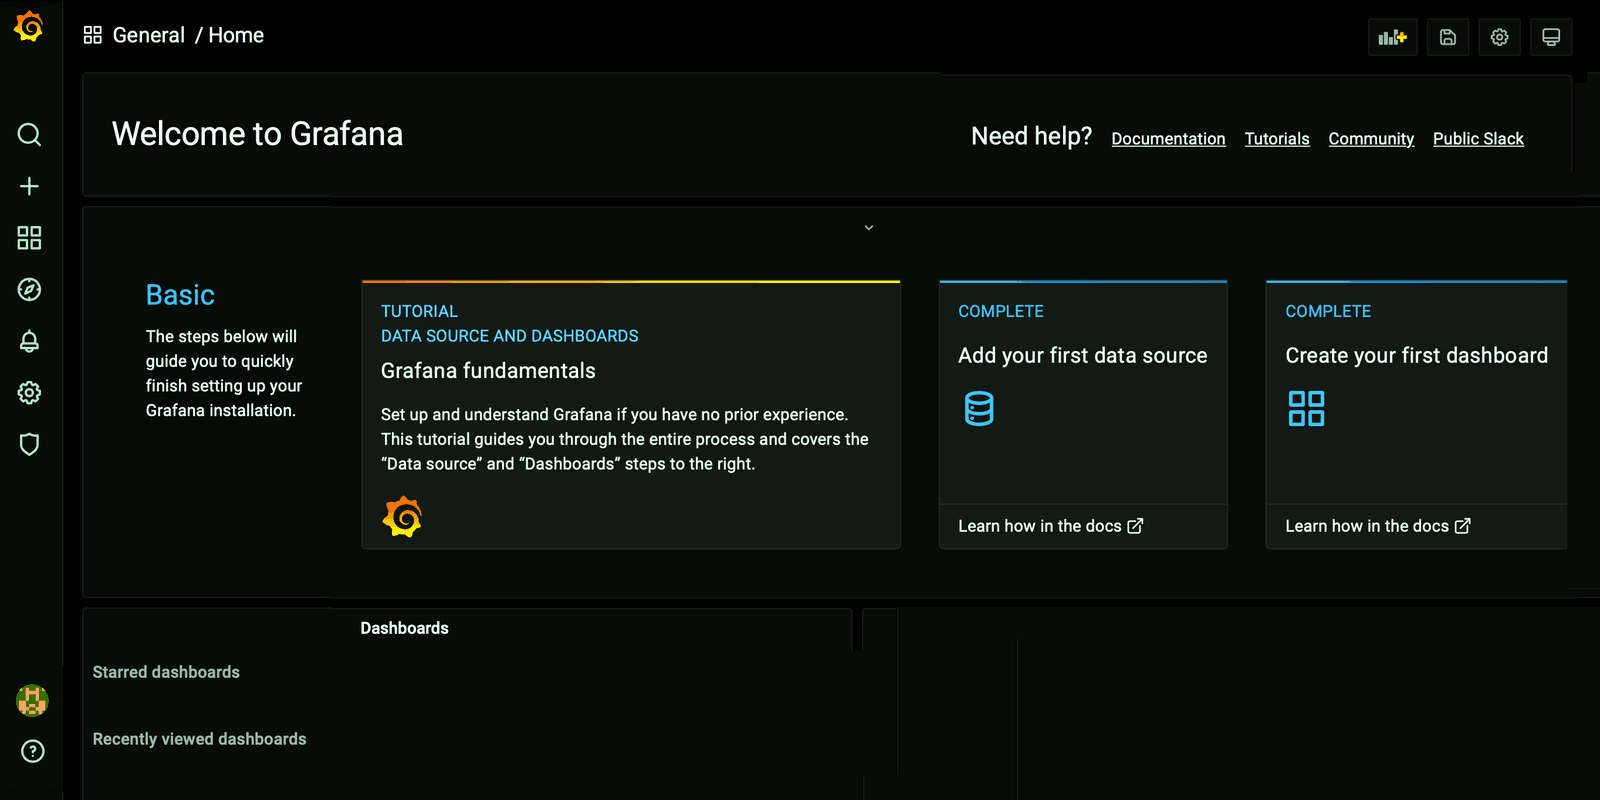
- Click the plus sign (+) in the navigation bar at the left side of the page (see the screenshot in Step 4 of the previous section). Select Dashboard on the Create drop‑down menu.
- Click the Add an empty panel box.
- On the New dashboard/Edit Panel page that appears, verify that Prometheus appears in the Data source field of the Query tab in the bottom half of the page. If not, select Prometheus from the drop‑down menu.
- Enter
nginxin the Metrics browser > field. A list of NGINX Plus metrics appears.Here are brief descriptions to give you an idea of what information they provide.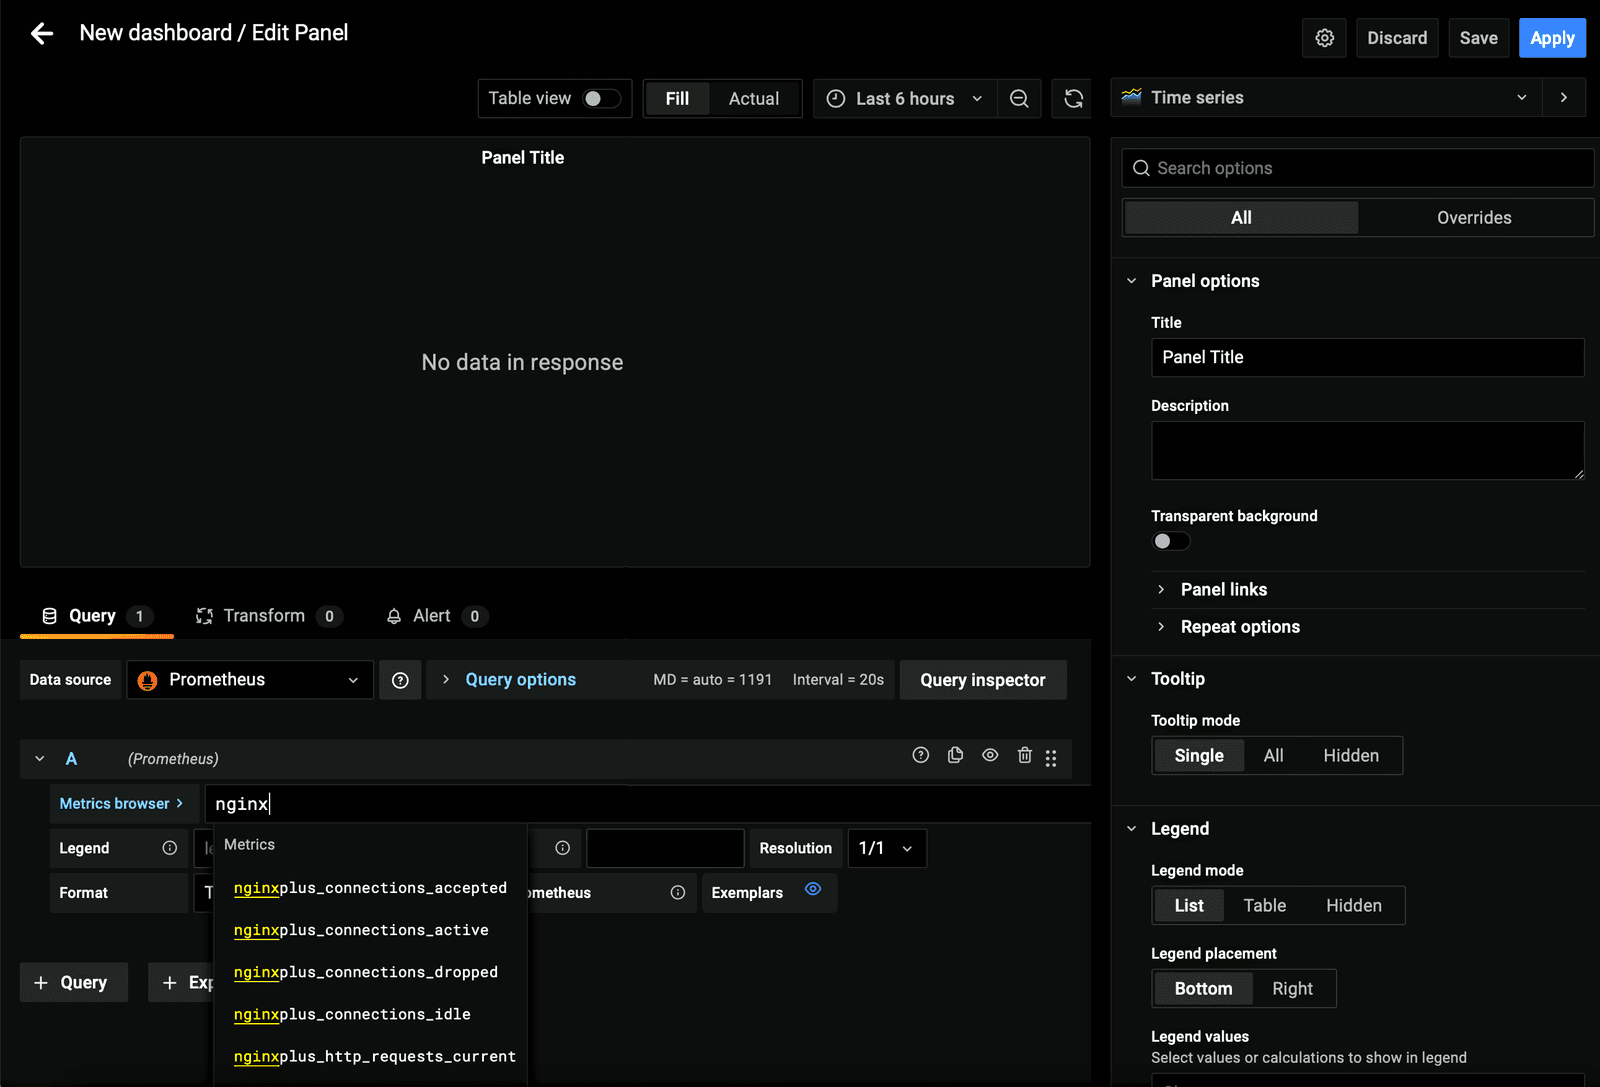
nginxplus_connections_accepted– Accepted client connectionsnginxplus_connections_active– Active client connectionsnginxplus_connections_dropped– Dropped client connections droppednginxplus_connections_idle– Idle client connectionsnginxplus_http_requests_current– Current HTTP requestsnginxplus_http_requests_total– Total HTTP requestsnginxplus_nginx_meta– NGINX meta informationnginxplus_processes_respawned– Total number of abnormally terminated and re‑spawned child processesnginxplus_ssl_handshakes– Successful SSL handshakesnginxplus_ssl_handshakes_failed– Failed SSL handshakesnginxplus_ssl_session_reuses– Session reuses during SSL handshakenginxplus_workers_mem_private– Private memory used by NGINX workers, does not include shared librariesnginxplus_workers_mem_rss– Memory utilized by NGINX worker processes
- Select a metric from the list (in the demo we select
nginxplus_connections_active). To select another metric, click the + Query button and select another metric in the new Metrics browser > field (in the demo, we selectnginxplus_connections_idle). - Click the "refresh" (two arrows forming a circle) icon above the graph in the upper half of the page, and results start to appear on the graph.

Bonus: Unified Insights and Analytics for All Your NGINX Plus Deployments
You may be asking “What if I’ve got a large NGINX deployment, including many NGINX Plus instances?” or “How can I update the configuration of my instances based on the insights and analytics from Prometheus and Grafana?” NGINX Controller, our control‑ and management‑plane solution for NGINX deployments, helps you address those questions and many more.
While Prometheus and Grafana are excellent solutions for monitoring, alerting, and visualization, they do not provide a way to update configurations and policies. Taking action based on these insights still requires logging into individual NGINX Plus instances to make changes, which can be time consuming and error prone – especially for large and complex NGINX Plus deployments.
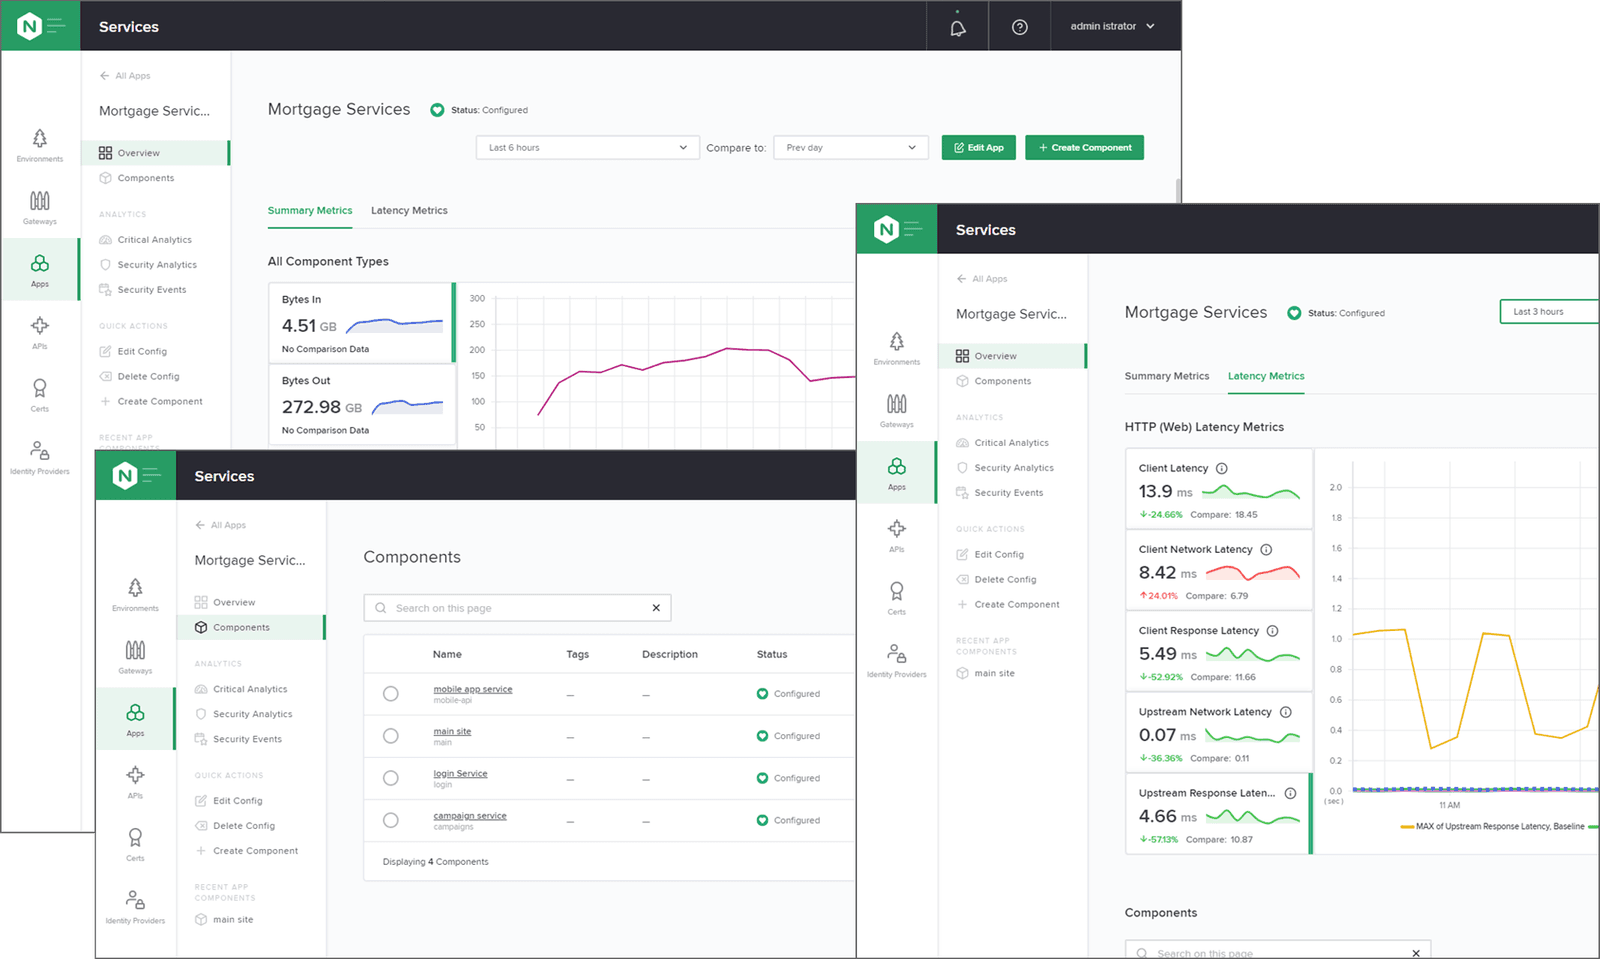
NGINX Controller offers deep insight and analytics on the 200+ NGINX Plus metrics, including requests per second, CPU usage, 4xx and 5xx errors, health check failures, and much more – all presented in an app‑centric, intuitive, and unified platform. You can then deep dive into the data, export it in reports, and make necessary configuration and policy changes leveraging automated, role‑specific workflows that were designed by NGINX experts to abstract away complexity.
With NGINX Controller, you can keep your finger on the pulse or you app deployments and take control of NGINX Plus instances and configuration objects (for example, Environments, Gateways, and Apps) at scale. And you don’t have to sacrifice use of your favorite monitoring and alerting solutions; Controller’s API‑first design makes integrating with third‑party solutions very simple and straightforward.
 
Get Started with NGINX Plus and NGINX Controller
If you haven’t tried NGINX Plus, we encourage you to try it out – as a load balancer, reverse proxy, and API gateway, or as a fully supported web server with enhanced monitoring and management APIs. Get started today with a free 30-day trial today or contact us to discuss your use cases.
And if you’re thinking NGINX Controller might be the way to visualize and monitor your NGINX Plus fleet, check out the free 30-day trial that includes both the Application Delivery and API Management modules with Controller App Security.
About the Author
Related Blog Posts

Secure Your API Gateway with NGINX App Protect WAF
As monoliths move to microservices, applications are developed faster than ever. Speed is necessary to stay competitive and APIs sit at the front of these rapid modernization efforts. But the popularity of APIs for application modernization has significant implications for app security.
How Do I Choose? API Gateway vs. Ingress Controller vs. Service Mesh
When you need an API gateway in Kubernetes, how do you choose among API gateway vs. Ingress controller vs. service mesh? We guide you through the decision, with sample scenarios for north-south and east-west API traffic, plus use cases where an API gateway is the right tool.
Deploying NGINX as an API Gateway, Part 2: Protecting Backend Services
In the second post in our API gateway series, Liam shows you how to batten down the hatches on your API services. You can use rate limiting, access restrictions, request size limits, and request body validation to frustrate illegitimate or overly burdensome requests.
New Joomla Exploit CVE-2015-8562
Read about the new zero day exploit in Joomla and see the NGINX configuration for how to apply a fix in NGINX or NGINX Plus.
Why Do I See “Welcome to nginx!” on My Favorite Website?
The ‘Welcome to NGINX!’ page is presented when NGINX web server software is installed on a computer but has not finished configuring